Companies can incur significant expenses when issuing a life insurance policy.
If policy lapses during the first few durations, the insurance company will not have collected sufficient premiums to recover underwriting and other acquisition costs. Applicants who routinely replace policies and agents who churn their book of business for commission purposes can prove to be quite expensive for an insurance company falling victim to this fraud. Unfortunately, for the insurer, these activities are very difficult to detect.
RGA recently completed a study with MIB Group, Inc (“MIB”) with the primary goal of quantifying the link between an individual’s level of prior insurance activity and the risk of early policy lapsation. This paper summarizes the findings of that study.
Executive Summary
The researchers completed a matched case-control study to relate MIB’s Extended Application Activity (EAA) alert to the risk of early policy lapsation. The results of the study suggest that a new policy issued with the EAA alert attached to it has greater than twice the risk of early lapsation. This result is supported across many variables including gender, issue age, risk class, product type, issue year, size band, and most issuing companies. In particular, the risk of lapse increased significantly for policies with smaller face amounts, those issued to older ages (50 and up), and those issued to females.
The “cases” in this study are based on a “lapsed cohort”, consisting of policies known to have lapsed during the first two policy durations. Four separate “control group cohorts” were also created by linking each policy in the lapsed cohort to four distinct and demographically equivalent policies.
By matching the control group cohorts to the lapsed cohort, we were able to control for many variables, including several known drivers of policy lapsation in order to more accurately isolate the independent value of the MIB EAA alert as an indicator of early lapse risk.
The lapsed cohort contains 369,279 policies, with nearly 2% having the EAA alert. Each control group contains the demographically equivalent policies, but less than 1% of each control group would have returned the EAA alert.
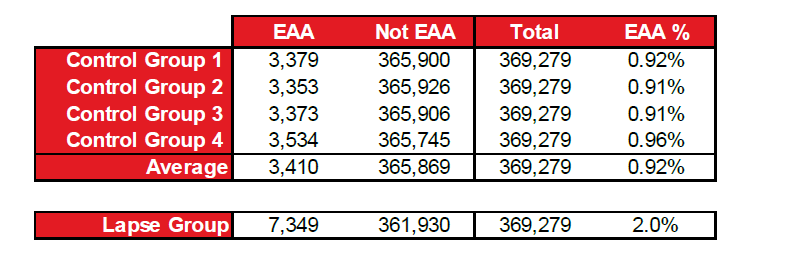
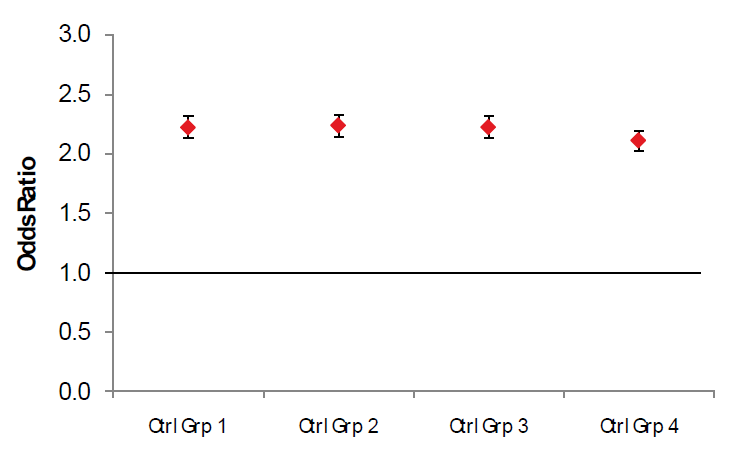
In a case-control study, a “pair” is defined as one case (i.e., an early duration lapsed policy) and a demographically similar control (i.e., a persister). The discordant pairs are used to calculate the odds ratios presented in the following chart. The overall average odds ratio is 2.20, which suggests a 120% higher risk of an early lapse for policies returning the EAA alert. The odds ratios for each of the four control groups are very similar, so averages of the four control groups will be presented throughout the rest of the paper.

Background
MIB is a not-for-profit membership corporation owned by 450 life insurance companies in the United States and Canada. Its flagship MIB Checking Service, and companion services (Insurance Activity Index, Plan-F Follow-up Service and Disability Income Record Service) provide the industry with fraud detection in the underwriting of individually issued life, health, disability income, long-term care, and critical illness insurance policies. The MIB Checking Service is a secure, shared data facility where member company underwriters (with applicant authorization) send and receive coded medical and avocational information that is significant to an insurance applicant’s health or longevity. Underwriters can then compare an MIB report with other information received during the underwriting process to uncover potential omissions, misrepresentations or fraud. An MIB report serves as an ‘alert’ that requires further verification prior to any underwriting action being taken.
The information exchanged between MIB and its member companies uses any one or more of 250 distinct MIB codes. MIB reports do not indicate what or if an underwriting action was taken. An individual’s MIB report is stored for seven years.
MIB’s Insurance Activity Index (IAI) records the frequency an applicant is searched against the MIB Checking Service database for the previous two years reporting both the type of coverage and whether the activity was new business, a reinstatement, or reinsurance. The IAI database has proven very effective in identifying individuals attempting to avoid the strict underwriting guidelines associated with larger policies by purchasing several smaller policies with lesser underwriting requirements from multiple companies in order to accumulate high amounts of coverage.
In late 2010, the Extended Application Activity (EAA) alert was added to the MIB Checking Service database. Driven from an extended seven-year IAI file, this new alert is automatically generated when an individual has at least one life insurance related MIB Checking Service inquiry in at least four of the previous seven years. The EAA alert is calculated by MIB from the extended IAI file, and entered into the Checking Service database as an alert to members; it is not reported by MIB members.
To conservatively ensure accuracy of the EAA alert, multiple MIB inquiries occurring within the same year for an individual, commonplace during policy acquisition, are consolidated and count as one year of activity during the seven-year look-back period. The determination of the EAA alert is based on a seven-year history ending in mid-September of the year prior to the trigger Checking Service inquiry. MIB uses a conservative methodology in generating the EAA alert, requiring an exact match of an individual’s search attributes in order to count subsequent application activity, thereby avoiding any close matches which could be a different individual. On this basis, the study’s primary finding of “greater than twice the risk of early lapsation” is a conservative estimate.
The EAA alert was created for the purpose of identifying applicants with a high level of past application activity that may indicate a higher risk for “early lapse”, which is defined as a lapse within the first two years following the issue of a policy. An MIB Checking Service inquiry for an applicant returning the EAA alert may not necessarily have fraud implications; however, it does indicate an elevated risk of early termination.
Data and Methods of Analysis
RGA provided MIB with a list of more than 2 million individuals who were issued a fully underwritten individual life insurance policy during 2008 or 2009. This list was our starting population for the study and contained both individuals lapsing during the first two policy durations and those persisting beyond two years (or at least still in force at the time data was drawn).
MIB compared the data submitted by RGA against the extended seven-year IAI database and reported over 5.1 million total inquiries on record for the individuals provided. These results included at least one inquiry on nearly all of the insureds submitted but, many times, the inquiries found in the IAI file were the inquiries for the policies identified in RGA’s data.
For the MIB Extended Application Activity study, the methodology used a matched case-control study design. The “cases” are defined as the nearly 400,000 policies (from the original 2 million insureds) that lapsed during policy durations 1 or 2. For this paper, this group is also referred to as the “lapsed cohort”.
Each of the four “control group cohorts” was created by randomly choosing a distinct, but demographically equivalent “match” for each of the case policies. For each control group, a “pair” is defined as one of the control policies and the case policy that matches. The matches were restricted to those policies not terminating for any reason during the first two policy durations. A match required several variables to be identical including: issuing company, risk class, gender, substandard rating, product type and policy size band. Additionally, the matches also required the issue age to be within two years and the issue date of the policy to be within 90 days.
The control group cohorts were matched to the lapsed cohort using several confounding variables available to us at the time of the study. These variables represented many of the known drivers of lapse rates and should help us to isolate the impact of the EAA alert on the risk of early lapsation. It is possible that unknown confounding variables have been ignored during the matching process overstating the value of the EAA alert. Additionally, this study attempts to eliminate the effects of all available confounding variables during the design stage, as opposed to the analysis phase, of the project.
The matched-pair results from a case-control study are typically displayed in a 2x2 grid as follows:

Cells a and d are the concordant pairs and have a similar EAA status. There are N total pairs of data, but we are primarily interested in b + c, or the discordant pairs. The odds ratio is calculated as the ratio of the discordant pairs:
Odds Ratio = b/c
The odds ratio indicates the additional risk present. As an example, an odds ratio of 1.5 indicates a 50% higher risk of an early lapse.
The 95% confidence Interval for the Odds Ratios is calculated using the following equations:

Results
Results by Gender
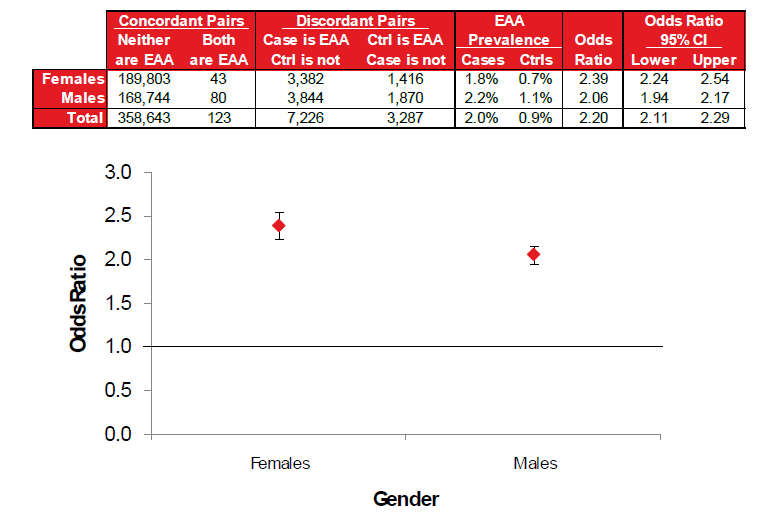
The risk of early lapse for females returning the EAA alert is noticeably higher than that of males.
Results by Issue Age
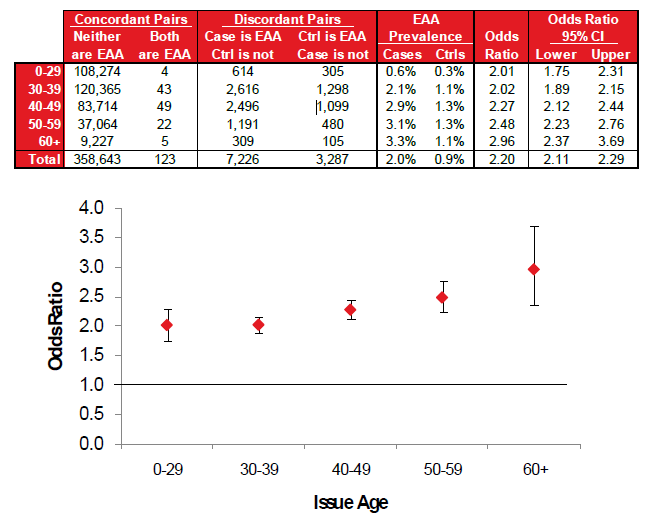
The risk of early lapsation appears to increase as issue age increases, but confidence intervals certainly overlap.
Results by Risk Class and Rating
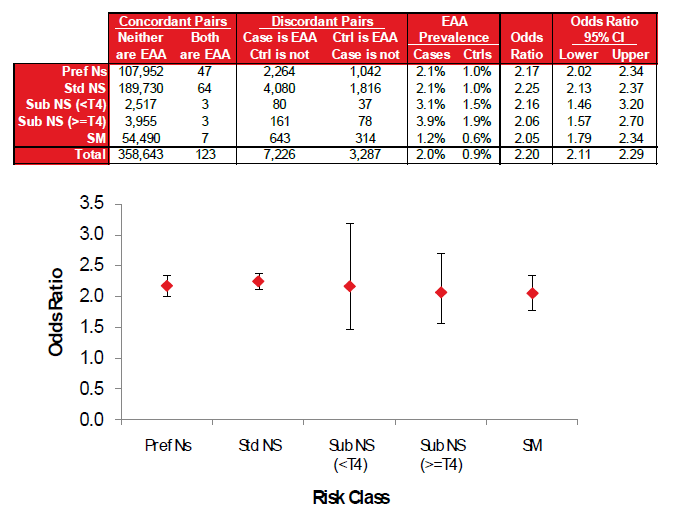
The odds ratios do not vary much by risk class or substandard rating.
Results by Product Type
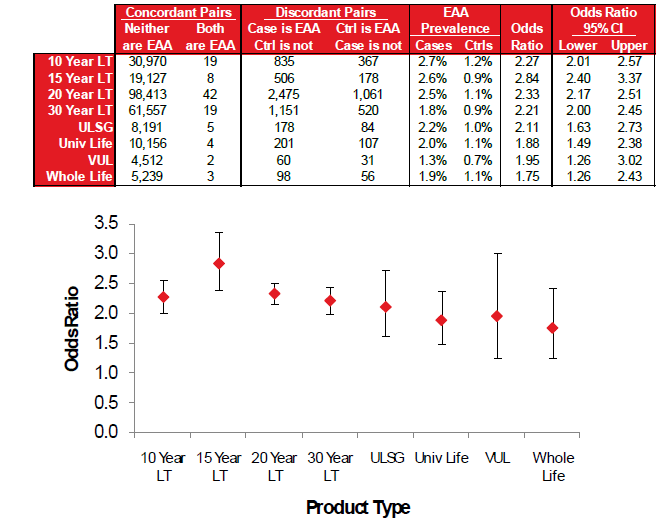
The following chart shows the results for a subset of the study by product type. The odds ratios seem to be slightly higher for term products.
Results by Issue Year
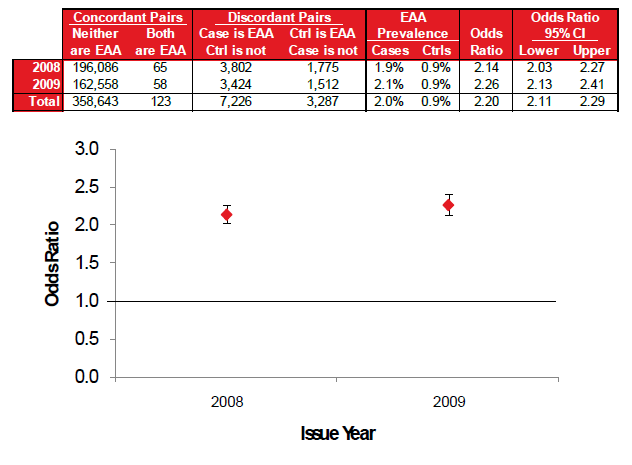
Since the data was collected in mid-2011, it was easier to identify the early duration lapses for policies issued in 2008 than for those issued in 2009. Some of the controls used for the 2009 issues would probably have ended up being “cases” (or early lapse policies). This could be the explanation for the slightly different results by policy issue year.
Results by Band
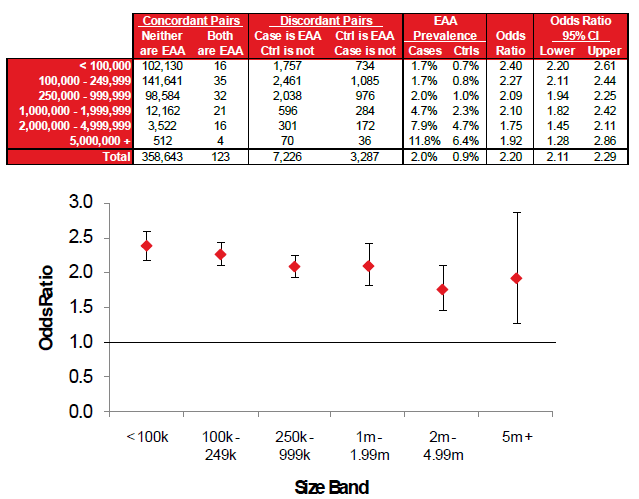
The odds ratios are higher for the smaller face amount policies, although the prevalence of EAA alerts increase significantly by increasing face amount.
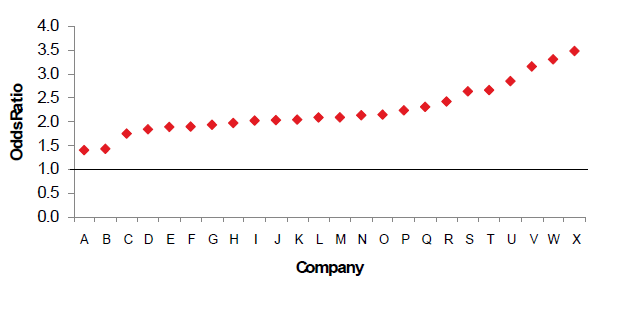
Results by Company
The company display features the results for many of the companies with a statistically credible number of lapses, but the confidence intervals are quite large at times and certainly overlap. The confidence intervals were intentionally left off the graph to maintain the anonymity of the companies. The early lapse risk of policies with the EAA alert appears to exist for all companies, but some companies are affected more than others.
Beyond the Extended Application Activity (EAA) Alert
The EAA alert is generated on MIB inquiries when an applicant has at least one life insurance-related inquiry in four or more of the previous seven years of IAI activity. This study has shown that, when setting the EAA alert cutoff at four or more years of activity, those with the alert have an average odds ratio of 2.20, or about 120% higher risk of early lapsation.
In addition to the standard definition of Extended Application Activity, it is also interesting to stratify the results based on the number of distinct years of an applicant’s IAI activity. The following table shows that the extra risk of early lapse increases monotonically by the number of prior years in which an applicant appears in the IAI database, although the prevalence of applicants with multiple years of prior activity does drop with each additional year.
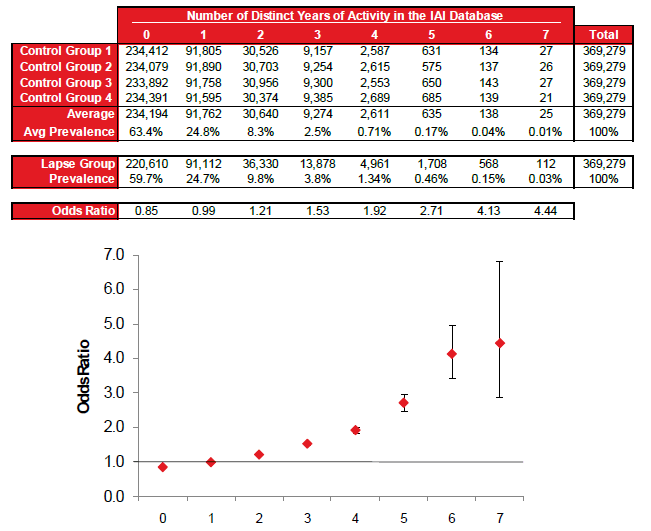
The inquiries returning the EAA alert as currently defined provide meaningful information to the insurance company, but the exact number of years of activity may provide more value. Based on implications, a company may choose to treat an inquiry returning a “4” different than they might treat one returning a “7”.
Protective Value Framework
The protective value of an underwriting test is generally determined by comparing the cost of the test to the benefits accrued by implementing the test. In this case, the marginal cost is de minimis for a company already using MIB’s fraud services, so we will focus on estimating the benefits. The benefits were calculated using an actuarial model to estimate the economic cost of early lapses, factoring in the prevalence and extra lapse risk of applicants with an EAA alert. A protective value formula would typically also adjust for the sensitivity and specificity of the test and the exclusivity of the information relative to other underwriting evidence. Given the high reliability of the reporting of IAI information and the lack of similar available evidence, we will assume no discount to the benefit calculation for these factors.
To estimate the economic cost of early lapse, an actuarial pricing model was developed for a 45-year-old male standard non-tobacco class purchasing a 20-year level term plan. A summary of the product and actuarial assumptions is included in the following table:
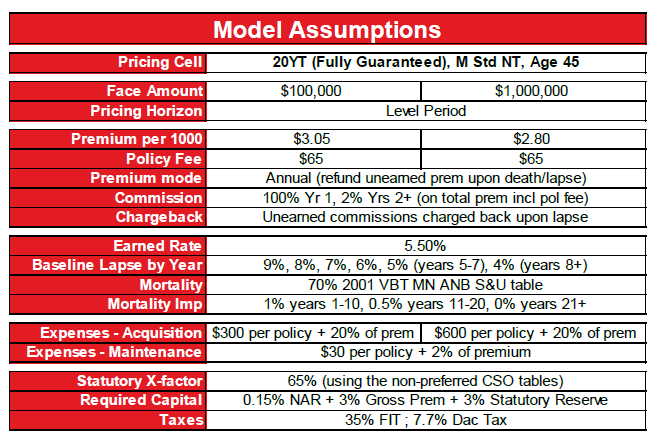
To calculate the cost of higher early lapse rates, the actuarial model was run using the baseline lapse rates, as well as two higher lapse rate sensitivity tests. The lapse rate assumptions for these sensitivity tests are provided in the following table:

The economic value of the product was calculated as the present value of distributable statutory profits at a 5.5% discount rate. The results for the baseline and sensitivity test runs are provided below for one policy:

The economic cost of elevated early duration lapse rates can be estimated as the difference between the baseline model profits and the sensitivity test profits. As an example, this results in a $539 economic cost attributable to doubling early duration lapse rates on a $1 million policy. To calculate the break-even value of using the EAA alert to screen out applicants with elevated early duration lapse risk, we must consider both the economic cost and the prevalence of the EAA alert in the applicant population. For a $100,000 policy, the prevalence of the EAA alert is approximately 1% of applicants. Using the economic cost from the “double” sensitivity test would result in a break-even value of $123 * 0.01 = $1.23 per applicant. For a $1,000,000 policy, the EAA alert prevalence is approximately 3%, so the break-even value would be approximately $539 * 0.03 = $16.17. For policies above $1 million, the EAA alert prevalence increases significantly as does the dollar amount economic cost of elevated early duration lapses. This demonstrates that there is clear economic benefit of using the EAA alert as an underwriting screen for extra persistency risk, especially for larger policies.


