Rates of diabetes, heart disease, respiratory disorders, certain cancers and other non-communicable diseases are increasing globally, and a growing body of evidence links lifestyle behaviors, such as physical inactivity, poor nutrition and smoking, to the increase.
It should come as no surprise that spending excessive time behind a computer or on a couch, using tobacco products, or eating fatty foods could have negative effects on longevity. The modern, sedentary lifestyle may be comfortable, but it contributes to a cluster of chronic and profoundly costly “sitting diseases.” Perhaps the clearest indication of this phenomenon is the dramatic and well-documented global rise in obesity rates over the past 40 years. The average adult today is 3 times as likely to be obese compared to the average adult in 1975.1
A growing waistline is directly associated with a shrinking lifespan. In fact, the World Health Organization (WHO) estimates that rising obesity levels are responsible for the growing prevalence of a range of non-communicable diseases, taking the lives of approximately 40 million people aged 30 to 70 annually. Worldwide the number of adults living with diabetes has almost quadrupled since 1980. In the United States, 30.3 million adults (nearly 1 in 10) have diabetes, 28.1 million have cardiovascular disease and almost 15.7 million suffer from chronic obstructive pulmonary disease (COPD).2, 3, 4 Together these conditions are responsible for more than half of all deaths globally each year.
Growing awareness of the health risks associated with inactivity is fueling interest in insurance-linked wellness programs that are supported by activity evidence from wearable devices. Against a backdrop of growing use of non-traditional evidence in underwriting and accelerated underwriting, it can be tempting for insurers to replace the costly and slow nicotine/cotinine screening required to reliably detect an applicant’s smoking status with data-driven variables reflecting physical activity. In this paper we investigate the relationship between physical activity, smoking and mortality risk using two large U.S. health data sets. We demonstrate that, while physical activity has a significant impact on longevity, no amount of exercise can negate the profoundly elevated mortality risk associated with smoking.
Challenges in Researching Lifestyle Behaviors
Technological advances have dramatically changed the capabilities of wearable devices since the early examples of simple pedometers and chest- worn heart monitors. In recent years, electronic activity trackers have entered the mainstream alongside a proliferation of smartphone apps and online platforms. The rapid pace of change in wearable hardware and the abundance of new devices make it challenging to research the importance of device- measured activity on health outcomes. For example, there can be significant differences in the metrics gathered from different devices. In a wearable trial, RGA found an 8% difference in steps reported from the two devices studied.5 While there is practical appeal of device-agnostic wearable research studies, differences in metrics by device pose serious challenges when trying to understand the importance of activity evidence from multiple devices.
Further complicating research studies, metrics collected from even the most advanced wearable devices may be inaccurate or difficult to interpret. For example, wrist-worn fitness trackers become less accurate with more vigorous exercise,6 and many manufacturers are careful to note that data from their devices may not meet the standards of a medical device regulated by the U.S. Federal Food and Drug Administration for efficacy and effectiveness. Fitbit declares that its product is “not a medical device” and Garmin notes its Vivosmart device is for “recreational purposes and not for medical purposes” and that “inherent limitations” may cause some readings to be inaccurate. Additionally, classifications for what constitutes a medical device have evolved over time.
Self-reported lifestyle information may help researchers avoid the problems associated with advances in wearable technology; however, relying on self- reported data introduces a greater risk of misrepresentation arising from recall and response bias (with physical activity often overestimated) and material differences in perception.
While wearable data open up exciting possibilities to better understand the impact of lifestyle behaviors on health outcomes, it is imperative that researchers verify accuracy, check for reasonability based on existing literature, and understand the underlying logic of calculations to reach replicable and scientifically sound conclusions.
RGA Lifestyle-Related Mortality Research Methodology
To understand the relationship between lifestyle behaviors and mortality, RGA investigated two national, health-related, mortality-linked data sets provided by the U.S. Centers for Disease Control and Prevention (CDC).7,8
The National Health and Nutrition Examination Survey (NHANES) is a heath and nutritional study of U.S. adults and children from 1971 to the present day. Mortality linkage is available in surveys from 1988 through 2010. The survey is unique in that it combines interviews and physical examinations and remains the only large-scale longitudinal study of objective physical activity in the U.S.
The NHANES III dataset and the follow-up surveys provide mortality-linked data (2011 follow-up) from 1988 – 2010.
| NHANES SURVEY | N (over 20 years old) | DEATHS |
|---|
| NHANES III (1988-1994) | 18,825 | 6,640 |
| NHANES 1999-2000 | 4,880 | 1,045 |
| NHANES 2001-2002 | 5,411 | 960 |
| NHANES 2003-2004* | 5,041 | 726 |
| NHANES 2005-2006* | 4,979 | 425 |
| NHANES 2007-2008 | 5,935 | 353 |
| NHANES 2009-2010 | 6,218 | 134 |
| TOTAL | 51,289 | 10,283 |
*Accelerometer (wearable) data is available in the 2003-2004 and 2005-2006 surveys, with steps available in the 2005-2006 survey.
RGA analysis of the NHANES dataset applied Cox proportional hazard survival models adjusted for age, sex, smoking, disease history (including coronary heart disease, stroke, COPD, diabetes and heart failure), health status and income. The models also controlled for the ability to walk a quarter mile in order to mitigate bias from individuals in such poor physical condition that they would likely not qualify for life insurance.
The National Health Interview Survey (NHIS), produced by the CDC, is one of the nation’s largest in-person household health surveys. It provides data for analyzing health trends and tracking progress toward achieving national health objectives and spans 1957 to the present day; mortality linkage is available in surveys from 1986 through 2009. The modeled population from NHIS in this analysis consists of 603,903 survey respondents, including 66,642 deaths. Each modeled participant had a household income above 2.5 times the poverty ratio, and all had an insurable interest.
Using NHIS data, RGA performed survival modeling to assess the impact of lifestyle behaviors on mortality in the U.S. population, controlling for age, sex, smoking, disease history, health status and income.
Controlling for health and income was intended to make the findings of the analyses applicable to an insurance population. Our findings are supplemented with evidence from two RGA wearable device studies and published findings in the medical literature. A thorough review of the scientific literature is critical to assess the reasonability of research findings.
Assessing Physical Activity and Mortality
Steps
Step counts present an objective measure of physical activity. Additionally, step metrics have been available for many years, providing a greater amount of historical data for evaluation than some other activity metrics.
The all-cause mortality ratios shown in Figure 1 segment the mortality of participants according to quintiles of measured activity with a reference category of 9,500 – 12,000 average daily steps. Those in the lowest quintile of steps per week – walking less than 5,200 steps – had the highest mortality. Mortality experience declines with increasing step counts, though there may be some evidence of a slight increase in mortality for those walking 12,000 or more steps.
Figure 1:
All-Cause Mortality Hazard Ratios by Average Daily Step Quintile
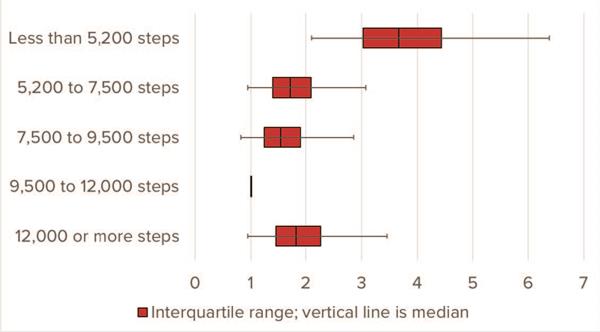
Source: RGA analysis of NHANES III 2005-2006 survey data. Multivariate model adjusts for: age, sex, smoking, disease history, health status, income and ability to walk a quarter mile.
While number of steps per day is certainly related to activity, it is important to note that measuring steps will not capture all elements of physical activity. For example, steps may be a reasonable activity measure for runners, but steps will not accurately capture the physical activity of swimming, cycling or even playing tennis. Wearable technology is rapidly evolving and devices are getting better at measuring other activities, but these measurements are difficult to compare against step counts. Therefore, it is important to review a host of activity metrics, not just steps, when trying to understand the relationship between physical activity and mortality.
Self-reported activity
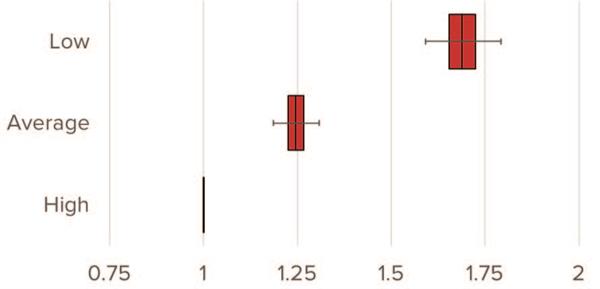
Self-reported physical activity can also provide insights into the impact of lifestyle behaviors on mortality and can eliminate some of the limitations inherent in measuring activity from steps. The NHANES survey asked participants to rate their perceived level of physical activity as low, average or high. The chart in Figure 2 reveals a strong association between lower levels of activity and increased mortality experience. Participants who reported the lowest levels of activity experienced nearly 1.75 times the mortality rate of the high-activity group.
FIGURE 2:
Hazard Ratio by Self-Reported Activity Level
Source: RGA analysis of NHANES III data, 1988-2010. Multivariate model adjusts for age, sex, smoking, disease history, health status, income and ability to walk a quarter mile.
To assess the validity of self-reported activity data, RGA investigated pulse rate relative to self-reported activity from NHANES. Survey participants who reported low activity levels had, on average, a higher resting pulse or heart rate (a measure of how many times the heart beats per minute while at rest), as illustrated in Figure 3.
This provides evidence that self-reported data in the NHANES data set is reasonable. Generally, a lower resting heart rate indicates more efficient heart function and greater cardiovascular health. Extensive research has connected a higher resting rate with a higher risk of cardiac events like stroke and heart attack.9
FIGURE 3:
Pulse Rate by Physical Activity and Gender
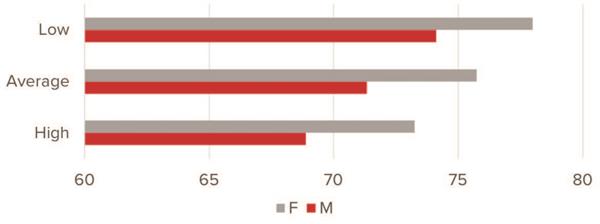
Source: RGA analysis of NHANES III data, 1988-2010.
While differences in perceived activity could inflate self-reported activity levels, the results from the analysis are in line with expectations. Self- reported activity and accelerometer data in the NHANES dataset were analyzed in the study, “Physical activity in the United States measured by accelerometer.”10 Researchers found that both objective and subjective measures of physical activity produce qualitatively similar results. The self-reported estimates are generally higher than those measured by accelerometer, possibly because participants might misclassify sedentary or light activity as moderate activity. It is important to note that NHANES survey participants are not incentivized to misrepresent self-reported activity data, and this would not be the case within an insurance application.
Duration and intensity
RGA leveraged data from the NHIS dataset to investigate the relationship between mortality experience and exercise duration and intensity.
As Figure 4 demonstrates, the mortality experience of those who do not exercise is far worse than those who do. These results align with the guidance from the U.S. Department of Health and Human Services, which recommends at least 2.5 hours of exercise a week.11
Figure 4:
All-Cause Mortality Hazard Ratios by Total Weekly Exercise Duration
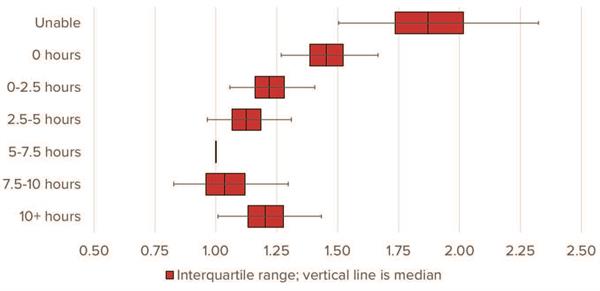
Source: RGA analysis of NHIS data, 1987-2009. Multivariate model adjusts for age, sex, smoking, disease history, health status and income.
Engagement in physical activity, particularly vigorous physical activity, becomes more important as we age. Numerous studies have concluded that regular participation in activities from moderate-intensity walking to very high- intensity sports increases accumulated daily energy expenditure and helps participants maintain muscular strength. In contrast, less active lifestyles have been linked to premature onset of cardiovascular and metabolic diseases, obesity, cognitive impairments and general frailty in the elderly.12,13
RGA studied NHIS data to better measure the impact of intensity on mortality experience. Findings in Figure 5 demonstrate the mortality experience of different age groups who do not exercise relative to the mortality of members of that same age group who exercise 2-6 times a week. The top set of bars compares moderate exercise by age, while the second set of bars compares vigorous exercise by age. Hazard ratios for those who do not exercise increase with age for both moderate and vigorous exercise intensity, indicating that physical activity is more important as we age.
Figure 5:
All-Cause Mortality Hazard Ratios by Intensity Level
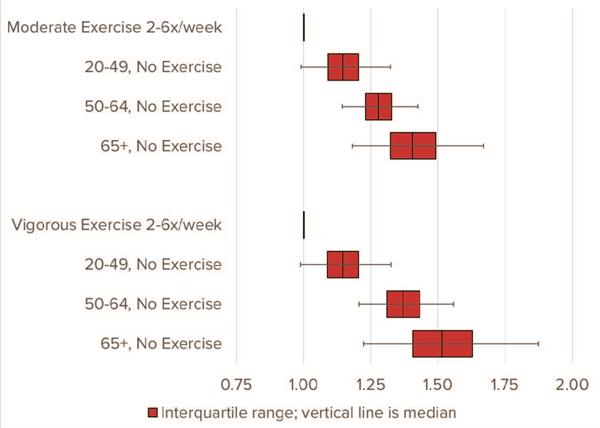
Source: RGA analysis of NHIS data, 1987-2009. Multivariate model adjusts for age, sex, smoking, disease history, health status and income.
Smoking
Despite decades of coordinated anti-smoking efforts, cigarette use remains the leading cause of preventable disease and death in the United States.14 Smoking is demonstrated to cause cancer, including 90% of all lung cancer deaths, 80% of all deaths from COPD and numerous other respiratory diseases. Estimates also show smoking increases the risk for both coronary heart disease and stroke by 2 to 4 times.14
While smoking rates have declined, approximately 18% of U.S. residents aged 25 to 64 are current smokers as defined by the CDC. In addition, one-fifth of the global population over the age of 15 is categorized as a smoker.15
Smoking continues to have profound implications for insurers. RGA developed a multivariate model using NHIS data to demonstrate that all- cause mortality experience for current smokers is 2.3 times higher than for individuals who have never smoked, as shown in Figure 6.
FIGURE 6:
All-Cause Mortality Hazard Ratios by Smoker Status
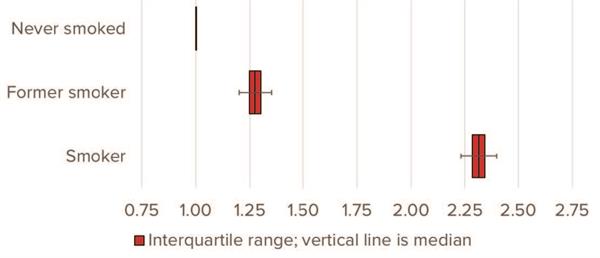
Source: RGA analysis of NHIS data, 1987-2009. Multivariate model adjusts for: age, sex, disease history, health status and income.
Those smoker and former smoker categories are further split in Figure 7. The upper portion of Figure 7 illustrates the relative mortality of smokers by number of cigarettes smoked per day relative to people who never smoked. Those who smoke more cigarettes have higher mortality risk. The bottom set of bars shows the mortality risk of former smokers by time elapsed since quitting, again relative to individuals who have never smoked. Mortality experience improves with time since quitting, with individuals who quit a decade ago exhibiting mortality risk very similar to individuals who have never smoked, with a small residual effect.
FIGURE 7:
All-Cause Mortality Hazard Ratios by Cigarettes Smoked and Time Since Quitting
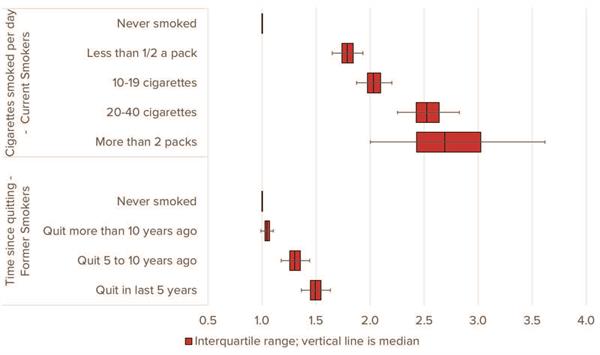
Source: RGA analysis of NHIS data, 1987-2009.
Physical Activity and Smoking
Physical inactivity is pervasive – and continues to drive worrying levels of non- communicable disease. So it is understandable to compare against another leading cause of mortality: tobacco use. In fact, such comparisons have led researchers and reporters alike to boldly declare that “sitting is the new smoking.” In other words, they claim physical inactivity is at least as detrimental to health as smoking. RGA set out to evaluate this claim by comparing mortality levels associated with both behaviors and determining the implications for insurers. The conclusion is clear: While a sedentary lifestyle is clearly linked to higher mortality risks, smoking remains far more deadly.
To study this, survey participants were grouped by both smoking status and physical activity. The measure of physical activity in this analysis was the perceived level of physical activity compared to people of the same age (peers). The top three bars in Figure 8 represent hazard ratios for people who have never smoked by activity relative to peers, the middle bars show experience of former smokers, and the bottom bars show the experience of current smokers by varying levels of self-reported activity compared to peers. Every group’s result is set relative to people who never smoked and who consider themselves more active than their peers. While mortality experience improves with more activity, even the more physically active smokers experience worse mortality than less active non-smokers.
FIGURE 8:
All-Cause Mortality Hazard Ratios by Smoker Status and Physical Activity Relative to Peers
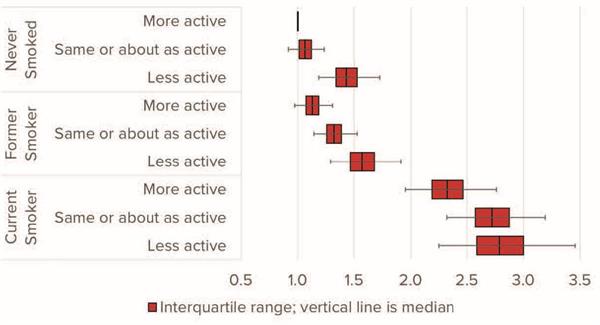
Source: RGA analysis of NHIS data, 1987-2009. Multivariate model adjusts for age, sex, disease history, health status and income.
Conclusion
Lifestyle choices, including physical activity and smoking significantly impact longevity. There are many challenges to researching the impact of lifestyle on mortality. As a consequence, it is critical that insurers view counterintuitive and sometimes conflicting reports with skepticism and ground risk assessment in statistically significant, reproducible analysis.
The evidence to date points to one conclusion: Exercise is still not a better predictor of mortality outcomes than tobacco use, even though exercise improves mortality experience and activity becomes more important as we age. A person cannot exercise away the damaging effects of smoking, but they can smoke away the benefits of exercise.
At RGA, we are eager to speak with clients about the science behind publications and studies, the underlying data, and how research is presented. Accelerating insurance shouldn’t require absorbing excessive risk. Contact us to learn how we can move forward together responsibly.