General aviation refers to all flight by noncommercial airline carriers.
This includes flights for personal transportation, in fixed-wing planes and jets, leisure flights in hot air balloons or gliders as well as commercial flight in helicopters. There are roughly 600,000 certified general aviation pilots in the United States. In 2010, 450 people died in general aviation crashes, which is a fatality rate of 1.10 per 100,000 flight hours. Accident experience over the period from 2002 to 2012 was analyzed and varies greatly by type of aircraft, the purpose and location of the flight, as well as the flying conditions and pilot training.
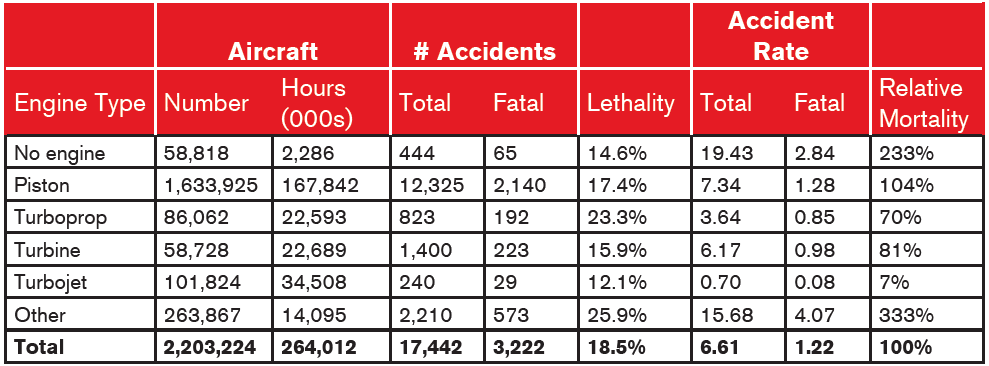
Engine type
- No-engine aircraft have the highest accident rate nand a mortality rate of 233% of the overall total.
- In the U.S., 75% of registered aircrafts have piston engines; the mortality experience for these planes is slightly worse than the overall
average. - Aircraft with turbine or turboprop engines have the best accident experience.
Type of aircraft
- Gliders had the worst accident experience with a fatality rate nearly four times the overall average.
Commercial and non-commercial flight
- Roughly 85% of general aviation flights have a non-commercial purpose.
- Commercial flights have a much better accident rate than non-commercial flights.
Region
- Accident experience is worst in Alaska as well as mountainous states in the Northwest U.S.region.
- There is an increased propensity to fly in Alaska; only 18% of communities are accessible by road and there are 6 times more certified pilots in Alaska than in the other states in the U.S.
Aircraft age
- Accident experience increases with the age of the aircraft.
Flight type and weather
- Flights conducted in visual meteorological conditions (VMC) are much more common and have an accident rate that is more than twice that of instrument meteorological conditions (IMC).
Overview
Personal airplane use is often the subject of media attention when celebrities and high-profile public figures such as John F. Kennedy, Jr., New York Yankees pitcher Cory Lidle, and Sen. Theodore “Ted” Stevens of Alaska are involved in fatal crashes. However, personal aircraft usage is not limited to the rich and famous. In the United States, there are approximately 600,000 certified pilots, operating a variety of aircraft.[1]
General aviation (GA) includes all civilian flying, except for commercial airline carriers. These include flights for commercial uses such as crop-dusting, sightseeing, reporting on traffic conditions, emergency medical services and firefighting, as well as flights for recreational and personal uses. The types of aircraft used for general aviation flight vary from private airplanes and jets to helicopters, gliders and hot air balloons.
In 2010, there were 450 general aviation fatalities compared to two deaths on large U.S. commercial carriers.[2] As a comparison, in 2010, there were 23,371 vehicle and 4,518 motorcycle fatalities in the U.S.[3] While the number of airline deaths is considerably lower, it is difficult to compare safety rates because the amount of exposure to each of those types of transportation is quite different. In 2010, the motor vehicle fatality rate was 1.11 per 100 million vehicle miles traveled, [3] the commercial airline fatality rate was 0.3 per 100 million passengers, and the general aviation fatality rate was 1.10 per 100,000 flight hours.[4]
Over the period from 2002 to 2012, approximately 18% of GA crashes were fatal. Many factors can contribute to accident fatalities. Aircraft fire is responsible for 40% of all crash fatalities.[5] Therefore, safety measures targeting reduction in aircraft fires will improve survival rates. Additionally, two-thirds of all weather-related accidents are fatal.[6] Other factors that influence the lethality of a crash include passenger use of safety restraints as well as whether the crash occurred in an off-airport location.
Approximately 85% of general aviation accidents are due to pilot error.[7] Alcohol is a known factor contributing to airline accidents. Consequently, the Federal Aviation Administration (FAA) has established regulations restricting pilots from consuming alcohol within eight hours of flight and requiring a blood alcohol level less than 0.04%. [8] In addition to alcohol consumption prior to flight, studies have found that pilots with prior DWI convictions are more likely to be involved in airline accidents.[9]Further, prior airline accident experience is associated with future accident propensity. Pilot inexperience can contribute to an airline accident; however, older pilots also have worse experience. [9]
Pilot certification
In 2013, there were nearly 600,000 certified pilots in the U.S. The average age of the pilot was just under 45 years old. Roughly half of these pilots also have an instrument rating, which includes training for flight relying only on instruments.
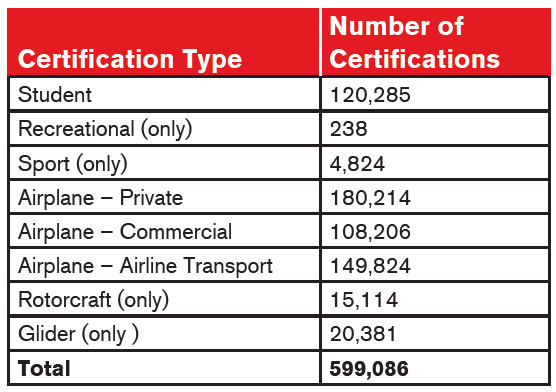
In total, the number of certified pilots has remained stable since 2004. However, there have been substantial changes in the types of certifications over this period. In 2010, the FAA increased the duration of student certificates from 36 months to 60 months; this resulted in a 65% rise in the number of student certificates. The FAA introduced a new “sport” pilot certification in 2005; while the total number of sport pilots is one of the lowest as of 2013, it is interesting to note the dramatic growth in this certification category since its introduction.[1] In 2013, the average age of a pilot with a sport certificate was over 55, more than 10 years older than the overall average. Sport pilot certifications require less training time than airplane certifications, but also have several restrictions, such as flying only certain types of aircraft, during daylight hours and in good weather.[10]
Experience varies based on the type of aircraft, the purpose and location of the flight, as well as the flying conditions and pilot training. This study investigates differences in general aviation experience from 2002 to 2012 in the United States. FAA aircraft data for 2011 are unavailable and therefore not included in the analysis.
Methodology
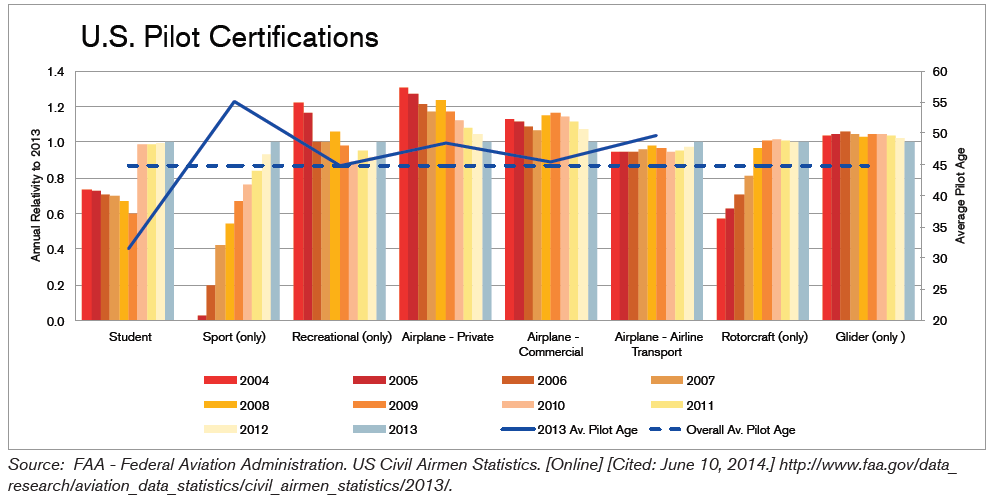
General aviation accident and fatality experience is analyzed over the study period. Exposure to accident is measured by the number of registered aircraft as well as the number of hours of flight. The accident rate is calculated as “number of accidents per 100,000 hours of flight”. [11][12] To estimate relative mortality, fatal accident rates are compared to the total. Most general aviation crashes are not fatal. There is a considerable difference between the number of fatal accidents and the total number of accidents. In this study, the proportion of accidents that result in at least one fatality is defined as “lethality”.
Overall experience
Over the study period, the number of GA aircraft in the United States remained stable at roughly 220,000. However, since 2002 the number of flight hours decreased about 10%. During this time, the number of fatal accidents declined, though the fatality rate remained nearly the same.
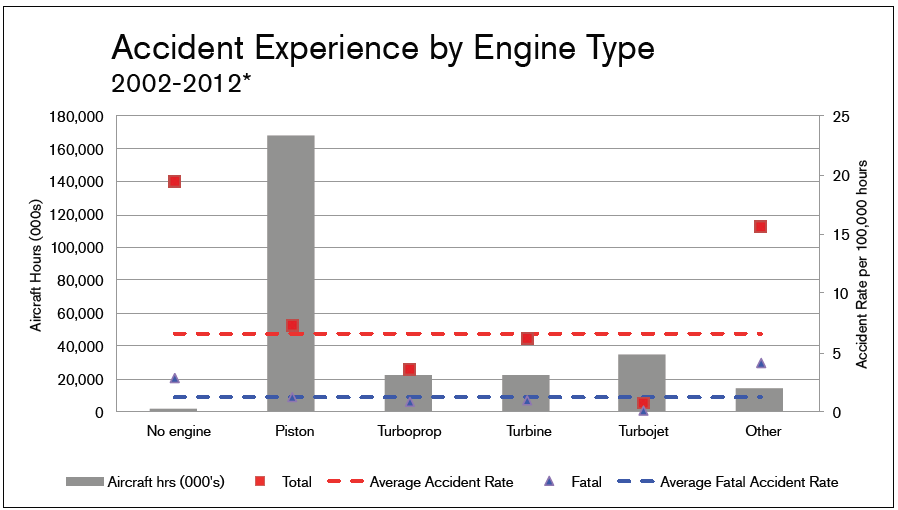
Engine Type
Summary
No-engine aircraft, such as gliders and lighter-than-air craft, experience the highest accident rate. This may be due to a lack of control or independent power, which leaves the airframe more susceptible to changes in wind speed and air pressure.
Piston (reciprocating) engines are the most common type of general aviation aircraft and are often found in fixed-wing aircraft. Overall, the accident rate for piston engines is slightly above average. Accident experience for aircraft with turboprop and turbine engines is much better than average; however, turboprop planes have relatively higher lethality.
The other engine category includes experimental and light sport accident experience, as well as those without a known engine. This group has the highest relative mortality.
*Excludes 2011
No engine
The fatal accident rate for no-engine aircraft remained relatively stable over the study period. Accident rate experience was volatile, and has been above average since 2006. Over the study period, the usage of no-engine aircraft has generally decreased.
Piston
The accident rate for piston engine aircrafts increased slightly over the study period, while the number of hours flown steadily declined. The fatal accident rate remained stable.
Turbine, turbojet and turboprop
Turbine, turbojet and turboprop engine types are similar in that they all use the turbine engine. However, a turbojet uses a turbine engine without a propeller, and a turboprop plane uses a turbine engine with a propeller through a gearbox. These engine types exhibit similar accident experience trends and are therefore presented together. The accident rates for turbine-powered aircraft dropped and flight hours slightly increased toward the end of the study period. Fatal accident rate experience also improved during the study period.
Type of Aircraft
Summary
The majority of GA aircraft flown in the U.S. are fixed wing. Over the study period, helicopters and fixed-wing aircraft had the lowest accident rates. Conversely, gliders are the most dangerous type of aircraft, and have a fatal accident rate roughly four times the overall average. The “Other” category includes lighter than air, experimental and home-built aircraft.
Glider
Gliders comprise the smallest group of aircraft in this study measured both by the number of aircraft and the number of flying hours. Further, the number of flying hours declined over the study period. However, during this same period, the accident rate experienced a steady and substantial increase. While gliders have the highest accident rate of all types of aircraft, the survival rate is better than average.
Fixed wing
Fixed-wing aircraft, including light-sport, are the most common type of GA aircraft and also showed the least variation over the study period. However, the flight activity, both by the number of active aircraft and the hours of flying, decreased over the period from 2002 to 2012. At the same time, the number of accidents declined, resulting in a stable accident rate over the study period.
Helicopter
Helicopter usage increased steadily, while the accident rates decreased. From 2004 to 2012, there was a 29% increase in the number of registered helicopters in the United Statesand a 76% increase in the number of rotorcraft-only pilot certifications.[1]
Commercial and Non-Commercial
Summary
General aviation is defined as any flight activity other than either scheduled mainline fleet operations (for example, commercial carriers such as American Airlines) or military operations. Furthermore, GA flight activity is segmented into both commercial and non-commercial flight activity. The commercial flight criteria apply to activities such as crop-dusting or sightseeing – essentially when the pilot receives direct monetary income. Conversely, non-commercial flight is non-monetary and often recreational.
As the following table suggests, commercial flight activity, although small in relation to
non-commercial experience, does exhibit a much safer accident rate. The results may be reasonable because:
- Commercial pilots are likely more experienced.
- There are more regulatory checks regarding the aircraft’s operation, equipment
requirements and maintenance intervals. - Commercial flight activity generally takes place at larger, manned airports.
Commercial flight
The accident rate for commercial flight activity has been declining in recent years.
Non-commercial flight
The accident rates are much higher for non-commercial flights and the accident experience has been slightly elevated since 2007.
Region and State
Summary
The FAA groups the United States and its territories into regions, as shown in the table below.
The mountainous regions, such as Northwest, Alaskan and Western Pacific, have accident rates and fatal accident rates that are higher than the overall average. The Northwest region has the highest relative mortality, at 24% higher than the overall average. However, the accident rate in the Alaskan region is 2.5 times higher than the total.
The map below depicts accident rate by state. The accident rate in Alaska is the highest, followed by the mountainous states in the Northwest region, including Idaho, Wyoming, Utah and Colorado. low high
Alaskan region
The region with the highest accident rate is Alaska. Some possible reasons include:
- Bad weather: Alaskan weather is more severe than in the other states.
- Rough terrain: The geography makes it difficult to land an aircraft safely in cases of emergency.
- Radar coverage: There is no radar coverage in some areas.
Perhaps the biggest differentiator for Alaskan flight experience is ‘propensity of flight’. The Alaskan road network is limited, so airplanes are used more often for some personal travel and commerce. Only 18% of Alaskan communities are accessible by road; [13] in fact, the third largest city and capital, Juneau, is not accessible by road. [14] As a result, Alaska has more certified pilots per capita than any other state. Over 1% of the population of Alaska has a pilot certification, which is 6 times higher than in the rest of the U.S., where less than 0.2% of the population are certified pilots. [1] [15] Furthermore, out of necessity, pilots may routinely conduct operations in conditions that might normally be considered unsafe.
All other states
The accident experience in all other states in much lower than in Alaska and has remained stable over the study period.
Aircraft Age
Perhaps not surprisingly, there is a relationship between the age of an aircraft and accident experience. Aircraft age is found by taking the difference between the date of the accident and the manufacture date of the aircraft. For some aircraft only a range of manufacture dates was known; the midpoint of the manufacture range was selected to calculate aircraft age.
When manufacture information was not available, the aircraft age is classified as “Other”. While this procedure is imprecise, a consistent relationship can be seen between aircraft age and experience. As shown in the table below, accident rates are higher for older aircraft.
Aircraft Hours
It is interesting to note that the average age of aircraft is actually increasing. In 2002, the average aircraft age was 28 years; in 2012, the average age had increased to 33 years. Since we see increased accident rates for older aircraft, this may mean a future increase in accident rates.
Flight Type
Under visual flight rules (VFR), a pilot must be able to fly the aircraft safely without the aid of instruments to avoid colliding with land or another aircraft. If the weather does not meet minimum VFR standards, then the operation of the aircraft must rely on instrumentation rather than visual reference; this is classified as instrument flight rules (IFR). The category ‘Other’ here refers to situations where either the flight type was not specified, or a special case of ‘VFR into IFR’, in which the flight starts out as VFR but, due to unforeseen weather, becomes an IFR flight. As the following table suggests, there is little difference between VFR and IFR, but other flight types experienced a much higher accident rate.
Weather Conditions
Experience varies based on weather conditions, described as visual meteorological
conditions (VMC) or instrument meteorological conditions (IMC). Flights conducted in VMC are much more common and have an accident rate that is more than twice that of IMC. However, if an accident occurs in poor weather, it is more likely to be fatal; the lethality for IMC is 4 times as high as that for VMC.
Conclusion
General aviation risks vary substantially by aircraft type and age, flying conditions, region, and flying purpose. No-engine aircraft, especially gliders, have dramatically worse accident experience than other types of aircraft. Glider accident rates during the study period were consistently higher than the accident rates for other aircraft.
Despite year-to-year fluctuations, the number of accidents is significantly lower for
commercial flight. The disparity between commercial and non-commercial flight activity is not surprising given the differences between the two environments, including regulatory requirements. In terms of geography, perhaps as expected, the accident experience in Alaska is poor relative to the remainder of the United States. This may be attributed to a greater need to fly due to the lack of roads and to challenging flight conditions.
This study finds that accident rates increase as the aircraft age increases. This is perhaps a result of needed maintenance. Additionally, older aircraft may be less likely to have useful safety equipment, such as instrument flight rules (IFR) capability.
Instrument flight rules (IFR)
Rules and regulations established by the FAA to govern flight under conditions in which flight by outside visual reference is not safe. IFR flight depends upon flying by reference to instruments in the flight deck, and navigation is accomplished by reference to electronic signals.[6]
Instrument meteorological conditions (IMC)
Meteorological conditions expressed in terms of visibility, distance from clouds, and ceiling less than the minimums specified for visual meteorological conditions, requiring operations to be conducted under IFR.[6]
Lethality
The proportion of accidents that result in one or more fatalities. Number of accidents (resulting in 1 or more fatalities)
Flight rules adopted by the FAA governing aircraft flight using visual references. VFR operations specify the amount of ceiling and the visibility the pilot must have in order to operate according to these rules. When the weather conditions are such that the pilot cannot operate according to VFR, he or she must use instrument flight rules (IFR).[6]
Visual meteorological conditions (VMC)
Meteorological conditions expressed in terms of visibility, distance from clouds, and ceiling meeting or exceeding the minimums specified for VFR.[6]