Aging populations and growing demands for digital insurance sales create a need to expand insurance rating factors beyond traditional underwriting criteria.
This article explores the value of several additional criteria, including consideration of frailty in older aged applications, the importance of sleep as well as the impact of personality on mortality expectations. The frailty index (FI) holds a robust and consistent correlation with mortality and morbidity and has been shown to be a strong predictor of mortality.
Inadequate sleep has been correlated with increased frailty as well as early mortality. Both short and long sleep duration are associated with greater incidence of obesity, diabetes, coronary heart disease, raised blood pressure and mental health disorders, leading to a risk of early all-cause and cause-specific mortality. Personality may influence morbidity and incidence of cancer through poor health behaviours. Adopting alternative non-traditional mortality and morbidity indicators into the risk assessment process can help more accurately define the underwriting terms offered.
Frailty
There’s no denying it: We’re all getting older. In fact, World Health Organization (WHO) data tells us that by 2050, there will be 2 billion people aged 60 and over, representing 22% of the world’s population. As the world population ages, frailty will become an important predictor of disability and diminished quality of life.
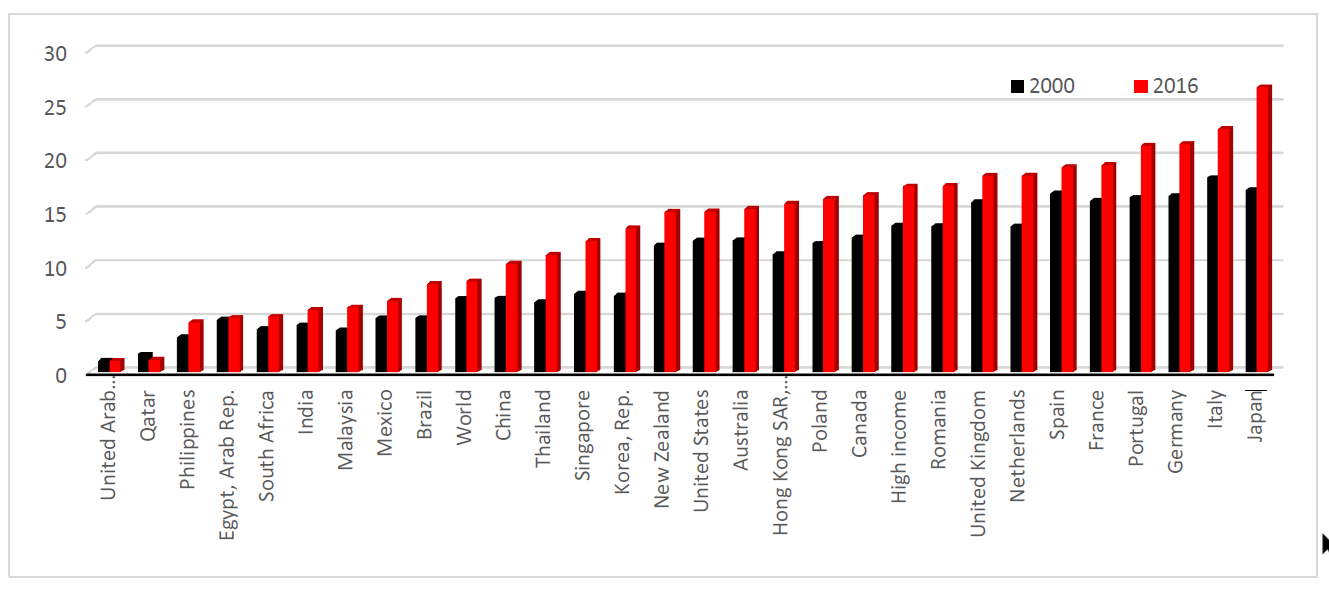
Figure 1:
Population ages 65 and above (% of total) by country1
For over a hundred years, the life insurance industry has been using blood pressure measurements in the risk assessment process. The HIV test was introduced in the late 1980s, and, more recently, prohibitions or moratoriums on using results from existing genetic tests results were introduced when policies are below certain limits. These are all clinical measures of health and well-being. Because insurance companies want to underwrite faster, smarter and more cost-effectively, there is growing interest in non-traditional risk assessment methods and predictive analytics.
Frailty itself can be a significant indicator of mortality, but it is usually overlooked in favor of traditional underwriting assessment methods. It is an age-related syndrome of functional decline leading to increased loss of independence and mortality. Frequently, it is assessed using the Fried Frailty Phenotype or the Rockwood Frailty Index. The Fried Frailty Phenotype treats frailty as a syndrome, with loss of physical function, using the classifications non-frail (robust), pre-frail and frail. Elderly people with one or two components are considered pre-frail, while those with three or more phenotypes are considered frail.2 The Rockwood Frailty Index sees frailty as a continuous risk and assesses the individual by noting the number of health deficits from a predefined list.
Here’s how a frailty index, such as the Fried Frailty Phenotype or the Rockwood Frailty Index, works. The index measures a range of age-related health deficits at a particular point in time. The number of health deficits is then tallied and divided by the total number of possible deficits, resulting in a percentage between 0 and 100%, where 100 relates to having all the deficits listed and 0 is having none of them.3
Social environment, personality traits, sleep quality and level of social activity are all significant factors in the health of older people. In addition, geographic region is another predictor of frailty. Studies examining rates of frailty and pre-frailty in low-, middle- and high income countries have shown large variations in prevalence, with rates of frailty being higher in upper-middle-income countries than high-income countries.
One of the key factors in pricing is age at policy inception. Mortality tables tell us that a 60-year-old should pay a higher premium for cover than someone half that age. Yet several studies have shown that the frailty index is a stronger predictor of mortality than chronological age. Frailty status may be a promising risk factor to add into the underwriting mix, particularly for disability products.
Some of the causes of frailty can be reversed through physical and psychological interventions as well as by creating awareness about the importance of healthy ageing. It has been shown in multiple studies and meta-analyses that regular participation in social activities leads to improved mortality in the elderly. Some studies have even shown that spending time with friends increases longevity over spending time with a spouse.
Frailty indexes are used in a diagnostic context in medicine, which is different from how a life insurer would use it as a screening tool. Yet the results from other screening tools, such as a sphygmomanometer for measuring blood pressure, a urine dipstick test or the humble weighing scales, are used effectively in both industries. Even the prostate-specific antigen (PSA) test, which has a low specificity and high false positive rate, is still used in clinical and insurance practice today. The frailty index is capable of assessing an individual using physical and mental health indicators, in a similar way that a medical examination in the doctor’s surgery does.
The current findings suggest that the risk of frailty can be reduced by following a healthy lifestyle and remaining active both socially and physically in later life.
Is your personality affecting your life?
Personality type doesn’t necessarily present an additional risk, but it is the behaviours associated with it which can alter mortality and morbidity outcomes. The Five Factor Model is a recognised framework of five broad traits commonly used to describe human personality:
- Openness to experience (expressing feelings, curiosity, creativity)
- Conscientiousness (self-disciplined, dutiful, planned behaviour)
- Extraversion (assertiveness, outgoing, positivity)
- Agreeableness (trusting, compassionate, helpful)
- Neuroticism (anxiety, hostility, depression, vulnerability, sensitivity)
Understanding the correlation between personality behaviours and mortality could help more accurately define areas of insurance risk.
Table 1:
Behaviours associated with personality types
| Openness | Conscientiousness | Extraversion | Agreeableness | Neuroticism |
|---|
| Social networks | Physically active | Social networks | Social networks | Stress and depression |
|---|
| Socially active | Health aware | Socially active | Social engagement | Increased alcohol consumption |
|---|
| Cognitive ability | Copes with stress | More likely to smoke | Likely married
| More likely to smoke
|
|---|
Most of the studies researched indicate the reasons why some personality traits increase or decrease mortality risk. Greater levels of extraversion, agreeableness and openness have been linked to a better overall health related quality of life. Social engagement, network size and marital status may explain the improved mortality in those with agreeable and extraverted personality traits. This would appear to back up findings that people who have large social networks and are socially active have improved mortality over socially isolated individuals. Openness has been correlated with cognitive ability, a known predictor of longevity while the conscientious personality type are more likely to attend for health screenings and take greater care of their physical and mental well-being.
It is the neurotic personality type that fairs more poorly. People of low socioeconomic status (SES) tend to have more negative feelings, including depression, anxiety and anger, which are associated with neuroticism. Certain personality traits (e.g. anxiousness) can also indirectly promote biological changes in the body, which in turn may lead to illness or disease. Low SES is a known risk factor for early mortality and, in particular, aggressiveness, hostile affect and cynicism are predictive of all-cause and cardiovascular disease (CVD) mortality.4 In a systematic review of 76 studies, personality characteristics were found to be more strongly associated with health-related quality of life outcome than sociodemographic factors including age, social integration and level of income.5
Optimism has been associated with lower blood pressure and lower levels of inflammatory markers. Traits such as optimism and responsibility all closely align with the conscientious personality type. Higher levels of conscientiousness have been found to predict greater longevity.6
With the continuing increase in life expectancy, health status indicators need to more accurately identify areas where early intervention may improve morbidity and mortality outcomes. It is apparent that psychological factors as well as physical factors play a role in health and longevity. Psychological tests are able to indicate personality behaviours with similar accuracy with which medical tests can predict health outcomes. Combining medical and non-traditional tests may enhance the overall underwriting risk assessment process.
To sleep or not to sleep: that is the question
Multiple studies show that sleeping less than six or more than seven hours at night increases the risk of an early death. Up to 37% of the population sleeps longer than required, while 12-16% of people do not get enough sleep.7 The Centers for Disease Control and Prevention reported that up to a third of American get less than seven hours of sleep. This is not surprising, given the fact that modern life requires longer work hours and more shift work than ever before. Health-related sleeping problems also affect up to 50% of the elderly population, due in part to underlying medical conditions, frailty and poor overall health.
The circadian rhythm (body clock) is influenced by levels of melatonin, a regulator of the sleep-wake cycle. It is a naturally occurring hormone that increases in the body as light fades and plays a key role in sleep duration. Night-time light exposure reduces the production of melatonin. Melatonin also induces heat loss and delays the production of cortisol, which increases blood sugar and blood pressure. It has been found to inhibit and slow down tumour growth, including prostate tumours. A recent meta-analysis of 61 studies that included a total of nearly 4 million participants showed that shift workers and night-time workers have a 19% increased risk of cancer.8 Furthermore, short sleep duration has been associated with vascular damage, for example coronary artery calcification.9 At the other end of the spectrum, people who sleep for lengthy periods of time may be at risk of atherosclerosis and subcortical macroscopic infarcts, both independent risk factors for CHD and CVD.
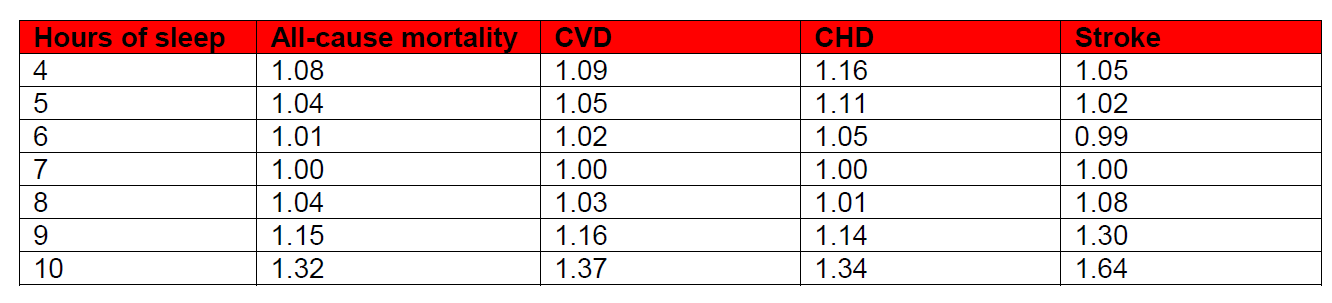
The majority of studies show that getting seven hours of sleep each night provides the greatest protection against early mortality. In a large meta-analysis of 67 articles covering more than 3.5 million participants from the U.S., Europe, Asia and Australia, length of sleep was strongly associated with all-cause mortality, CVD, CHD and stroke.
The same study provided an analysis of the association of sleep duration with mortality and morbidity by geographic location. It offers additional value in considering whether or not to use this risk measure by different regions around the world. Alternatively, sleep duration as a risk factor could be incorporated with other measures to create a lifestyle index score. An Australian study previously examined the relationship between a lifestyle index score and all-cause mortality. Higher lifestyle risk index scores were more common in men, in those age 80 and over, those who were single and those with a lower level of education. Compared to those with no risk factors, all-cause mortality increased as the lifestyle score went up.11 Development of a lifestyle risk index score, using traditional and non-traditional risk factors to create a model for risk assessment, could have great potential in the life insurance industry. These factors could include level of education, SES, income, sleep duration, frailty score, amount of social and physical activity, and diet.
Conclusions
It may be possible for frailty index to be integrated into the underwriting process, specifically for illness and disability products. Additional consideration needs to be given to the applicant’s level of social activity, social network size and sleep duration, all of which can alter mortality. Furthermore, the conscientious individual may live longer than his or her neurotic neighbour. The various ways in which clinicians apply medical research study findings are very different from how the insurance world utilises the information. Sometimes this salient point can be forgotten in the midst of searching for the ultimate evidence-based underwriting methodology. The possibility of using alternative, non-traditional risk indicators can get lost in the race for applying big data techniques and implementing ‘predictive underwriting.’ However, they have been shown to be viable predictors of all-cause and cause specific mortality. The race may have started, but it’s still a long way to the finish line.