Underwriting
  • Research and White Papers
  • March 2025

Underwriting in Transition

The impact and opportunities of AI in data structuring

By
  • Mark James
  • Laiping Wong-Stewart
Skip to Authors and Experts
Woman sitting at a computer with three monitors
In Brief
This article, originally published in On The Risk, explores the transformative impact of AI on the underwriting process, highlighting how RGA's partnership with DigitalOwl is leveraging generative AI to revolutionize data structuring and analysis in insurance underwriting. It also acknowledges the ongoing need for validation and refinement of AI-generated data to ensure its reliability in real-world applications.

Key takeaways

  • Generative AI models can now consolidate and organize complex medical information from lengthy underwriting files into concise, accessible formats, significantly streamlining the traditionally labor-intensive process of manual data interpretation.
  • By presenting information in intuitive, easy-to-consume formats, AI-structured data empowers underwriters to make more precise, efficient, and informed risk assessments across various medical impairments and laboratory findings.
  • While AI offers significant benefits, there are ongoing challenges in ensuring the accuracy and reliability of AI-generated structured data, necessitating continued validation, refinement, and development of improved tools to build confidence in AI-assisted underwriting processes.


Effective underwriting has always hinged on the ability of underwriters to interpret and organize vast amounts of data, from medical records to diagnostic findings. This data structuring in underwriting has traditionally been a labor-intensive, manual process requiring underwriters to sift through hundreds of pages to gather the relevant information necessary to make sound decisions.

However, with the advent of AI-assisted tools, the potential for streamlining the way underwriting data is structured and utilized is evolving. Generative AI models can consolidate and organize complex information, making it more accessible and actionable.

But this begs the questions: How do these advancements compare to traditional methods… and what do they mean for the future of underwriting?

Drawing on RGA’s partnership with DigitalOwl, this article explores real-world use cases to examine the opportunities and challenges of leveraging AI to structure and present underwriting data.

Underwriting three ways

Let’s examine an underwriting case: A 71-year-old woman presents with a history of anxiety, depression, type 2 diabetes, and chronic pain requiring opioid medications. In reviewing this file, we determined that while her diabetes was well controlled, her depression had worsened and was associated with concurrent anxiety, and she had recently started on a new medication, as shown in the images below.

Exhibit 1: Medical record example
Exhibit 1


Exhibit 2: Medical record example, continued
Exhibit 2


Using this information, the underwriter accurately assessed this applicant’s risk. However, this underwriting file totaled approximately 433 pages, including the application, paramedical exam and labs, and medical records outlining the applicant’s medical history.

Thanks to RGA’s collaboration with DigitalOwl, underwriters now have access to their generative AI models that streamline the process by creating PDF summaries. These summaries transform lengthy underwriting files, such as this 433-page case, into a more concise, accessible format as shown in Exhibit 3.

Exhibit 3: AI summary
Underwriting in Transition: Exhibit 4


Duplicate information that was initially found scattered across multiple areas of the underwriting file is now presented in a concise, underwriter-friendly format. This allows the underwriter to navigate the applicant’s medical findings strategically and logically, enabling more efficient and confident risk assessments.

But what about the data?

Generative AI’s ability to structure medical and diagnostic findings makes the data in each underwriting file easily digestible across various contexts and formats.

For example, in addition to PDF summaries, DigitalOwl produces both Excel output files and machine-readable JSON files at the case level. Their DATA API technology further enhances deeper analytics by allowing users to retrieve large volumes of structured data through API calls based on medical items, mentions and more.

For clients requiring customized outputs for batch processing, there are two key solutions available:

  1. Customized Tabular Worksheet (CTW): Developed in collaboration with RGA, this format consolidates selected information into a tabular structure tailored to client needs.
  2. Post Issue Audit (PIA): Based on a client’s underwriting philosophy, this Excel-based report summarizes findings. In the coming months, DigitalOwl’s Triage Tool – a new AI-driven audit solution – is scheduled to supplement their existing PIA report.

The Excel output file below provides the same information initially summarized in the PDF format. However, it is now organized by relevant impairments, dates each impairment occurred, and even potential severity as predetermined by the AI’s configuration.

Exhibit 4: PDF format
Underwriting in Transition: Exhibit 4


With the ability to formulaically classify various “medical items,” underwriters can now prioritize medical findings by relevance and severity. In addition to the medical items listed above, the Excel output file also contains the following information:

  • An overall case summary
  • Biometric information, such as height, weight, and blood pressure, with page references to the source material
  • Provider details related to listed medical items
  • Laboratory results with test names and service dates
  • A list of medications, including prescription fill dates
This overview represents only the surface of what is possible. When diving deeper into the data within these files, new pathways emerge, leading to previously untapped opportunities.

For example, the same depression history outlined in the medical records and PDF summary can also be found in the machine-readable JSON format, shown in Exhibit 5. Through generative AI’s ability to categorize each medical finding, all potential medical codes associated with these findings are also provided, such as LOINC, ICD-10, SNOMED, etc.

Exhibit 5: JSON format
Exhibit 5


Organizing these impairments and findings in this manner makes it feasible to input data into various rules engines or severity models to streamline underwriting decisions. In other words, the same information that previously required an underwriter to manually review a 400-plus page file can now be interpreted by a rules engine.

Beneath the surface

Clearly, the impairment analysis has become easier and more efficient with the integration of AI. But, again, we have only begun to explore the possibilities of consolidated and organized data.

Take laboratory data, for example. Given the variety of sources in which lab results are provided – whether from insurance panels, third-party data, electronic health records, or attending physician’s statements, underwriters must often review each independent lab value from its respective source. This process can be cumbersome, requiring underwriters to piece together results to estimate mortality based on recent findings, trends, or averages.

However, with generative AI’s ability to re-structure all lab findings, we can now develop rules- based logic that is more encompassing. The following snapshots illustrate how lab tests can be categorized, filtered, and assessed, regardless of their source.

Exhibit 6: Customized tabular worksheet (CTW)
Underwriting in Transition: Exhibit 6


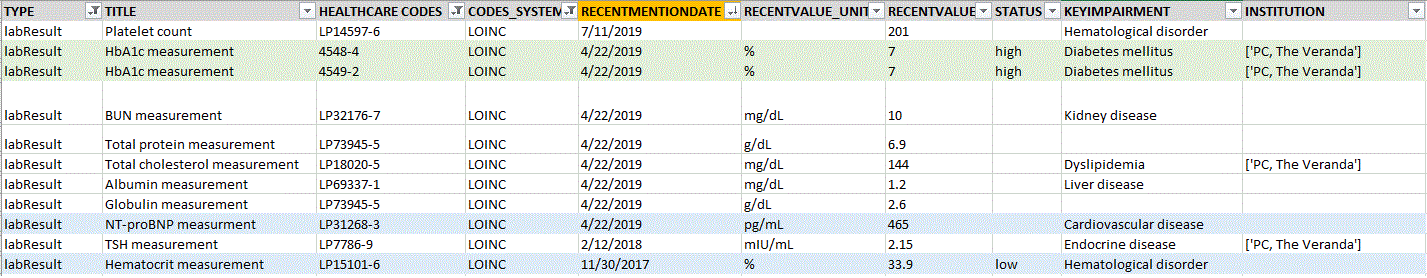
Exhibit 7: Excel output
Underwriting in Transition: Exhibit 7


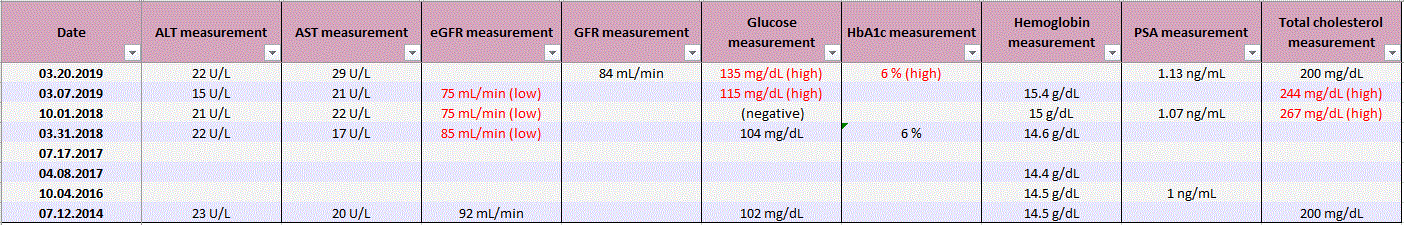
Whether using a customized tabular worksheet or a case-specific Excel output, underwriters can now consolidate laboratory findings from all available sources into a streamlined format. This consolidation offers significant opportunities:

  • Precise analysis of less common labs – Underwriters can now analyze lab tests that are less common across various sources. For example, NT-proBNP testing is more common on insurance panels, while CBC findings are generally found in medical records or third-party data, as shown in blue on the CTW in Exhibit 6. Previously, this required cross-referencing findings within their respective source documents. By consolidating all laboratory findings and relevant results, regardless of their source text, underwriters are less likely to overlook or dismiss a potentially significant finding worth consideration.
  • Simplified trend analysis – Trend analyses, such as the glucose testing shown in the Excel output in Exhibit 7, are now more straightforward. Underwriters can examine all values of a particular test, regardless of its source location. This capability is extremely valuable when tests oftentimes are scattered across larger underwriting files.
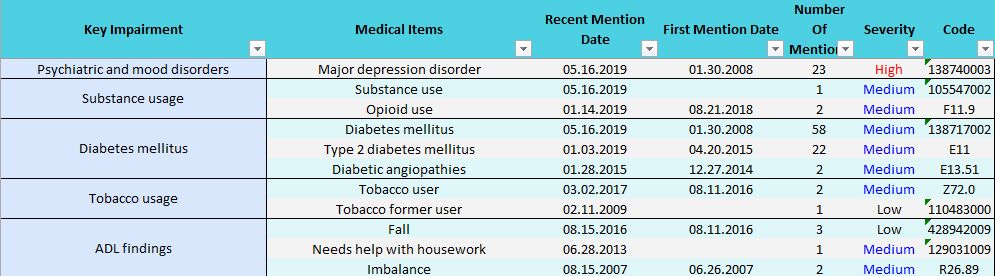
  • Reviewing recent findings across requirement – Consolidated outputs allow underwriters to review recent findings from all underwriting requirements simultaneously. The Excel format automatically organizes by date, while the CTW highlights the “recent mention date” (highlighted in orange in Exhibit 6), which addresses the most recent results. This feature applies to medical impairments and diagnostic tests, providing the underwriter a clear, organized view of findings by severity and date.

Furthermore, categorizing these findings by “key impairments,” and associating them with relevant codes, such as the A1c test highlighted in green in Exhibit 6, enhances data consolidation. This enables the development of impairment-specific rules or severity models. With all underwriting data consolidated, underwriters gain the ability to organize relevant information logically, dynamically, and accessibly, unlocking a wealth of possibilities.

In essence, the value of structured data lies in its organization. By presenting information in an intuitive, easy-to-consume format, structured data empowers underwriters to achieve more precise, efficient, and informed decision-making.

Opportunities and expectations

Like PDF summaries, structured data is just a way to present the results of a generative AI model. As such, concerns about accuracy in AI models also apply to the structured data they produce.

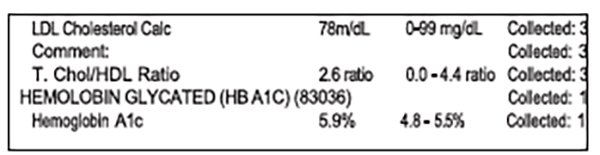
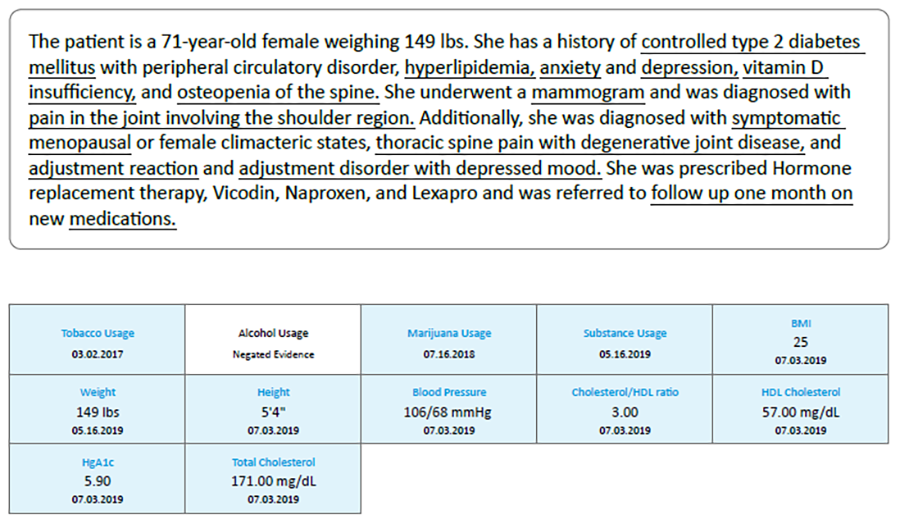
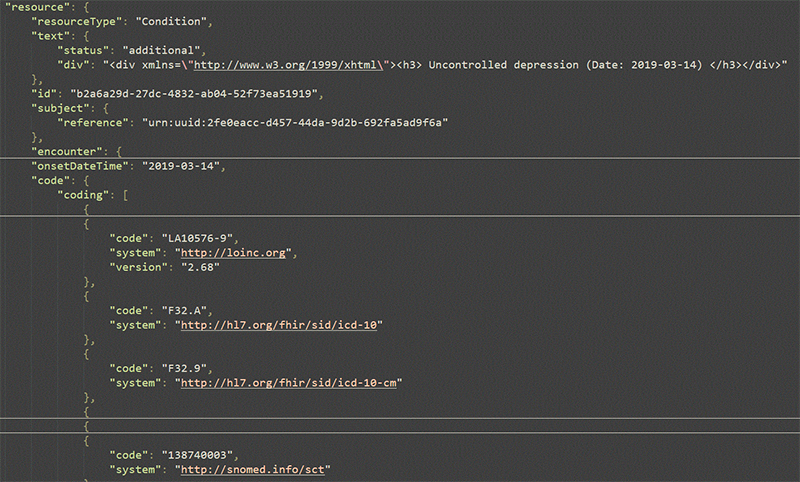
Validating this data is critical. For example, the model may misinterpret or omit medical findings, especially when the input data is complex or unclear. Exhibits 8 and 9 illustrate a case where the model incorrectly identified an individual as having diabetes mellitus. Further investigation revealed that this was simply a diagnosis code used to order glucose testing, and the test result itself was normal. Nevertheless, this erroneous diabetes diagnosis appeared across all structured data formats as well.

Exhibit 8: Chronological overview of conditions or events
Underwriting in Transition: Exhibit 9


Exhibit 9: Hemoglobin A1c result
Underwriting in Transition: Exhibit 9


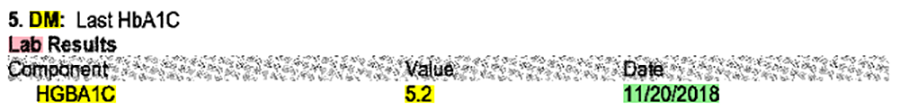
Exhibit 10 highlights another challenge: A patient’s Crohn’s disease was omitted because the generative AI model was unable to reliably interpret the handwritten details. As a result, all structured data formats failed to mention the patient’s history of Crohn’s disease.

Exhibit 10: Crohn's disease finding
Underwriting in Transition: Exhibit 10


The presentation of medical impairments or diagnostic findings in structured data comes with unique challenges. For instance, while Exhibit 6 highlights the significant benefits of the customized tabular worksheet for data consolidation, there are many instances where fields like “Institution” are left blank. Underwriters must evaluate the relevance and reliability of assessments based on the information source. Further refinement is needed for generative-AI to accurately identify and associate medical findings with their exact sources.

These challenges are due to ongoing efforts to validate structured data based on PDF summaries and an underwriter’s ability to review them. DigitalOwl’s PDF summaries provide hyperlinks to source data, enabling underwriters to verify the legitimacy of the data. This allows underwriters to trace impairments back to their original sources and assess what led to the condition’s “diagnosis,” as seen in the diabetes example in Exhibits 8 and 9.

Consistency and accuracy in structured data are essential – not only for proper risk management in underwriting but also for auditing and claims adjudication.

As generative AI continues to evolve, whether applied to underwriting workflows or case notes, like those from DigitalOwl, the need for improved validation tools and techniques will become critical to advancing structured data analysis and risk assessment.

With continued validation and refinement, the challenges of ensuring accuracy and building confidence in AI-structured data will gradually diminish. Once these hurdles are overcome, opportunities for structured data consolidation and rules development will expand, turning what once seemed a distant future inevitability into a present-day reality filled with possibilities.

And this is only the beginning.


More Like This...

Meet the Authors & Experts

Mark James
Author
Mark James

Director, Underwriting Innovation, Strategic Underwriting Initiatives (SUI)


Laiping Wong-Stewart
Author
Laiping Wong-Stewart
Vice President, Actuary