The first few months of 2015 exhibited exceptionally high mortality experience in several countries, including the U.S., Japan, and the U.K. This experience was noted by insurance investment analysts, and research was carried out during the first half of 2015 to further develop an understanding of the underlying causes. The new research built on the 2012 seasonality research conducted by RGA1.
The 2012 study had highlighted how a variety of demographic, socioeconomic, and geographic factors influence the degree and direction of seasonal mortality. The 2015 research focused on global seasonality, and how flu and pneumonia (F&P) mortality correlates with other causes of death. These findings were used to monitor the 2016 season, which turned out to be less severe than the 2014-15 season, when flu vaccine effectiveness was especially poor. This article focuses on understanding how seasonality varies by country and region, and how F&P mortality correlates with other causes of death.
Introduction
Seasonality refers to a trend pattern that repeats every 12 months. In insurance, knowledge of seasonality’s impact on mortality is not new. Life insurers sometimes experience poor financial results stemming from large fluctuations of claims in colder months. The ability to understand the main drivers of seasonal mortality, and therefore why certain years have higher seasonal mortality than expected, can be vital for insurer reporting and planning.
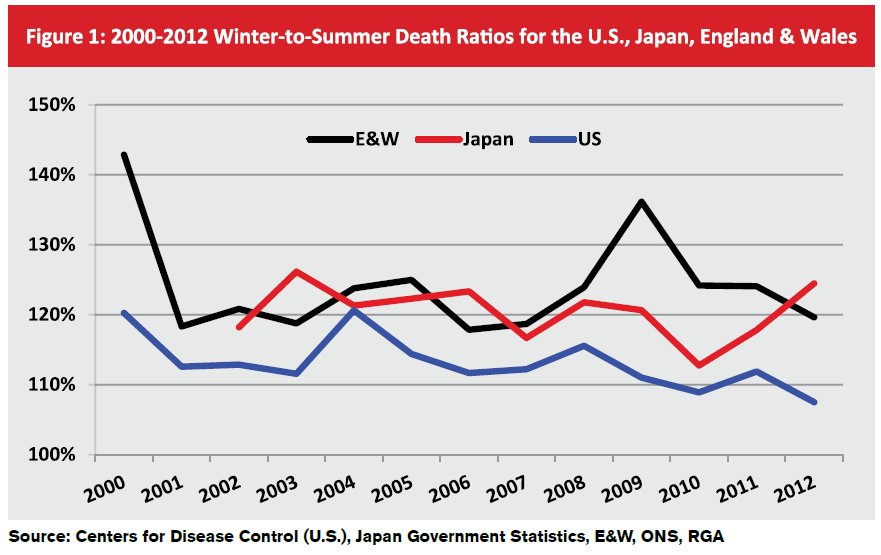
Although higher mortality is expected in winter months, the magnitude of seasonality can vary by year and is unpredictable. One method of assessing the degree of seasonality by year is via the winter-to-summer ratio. This ratio is defined as shown below.

Note that the ratio’s values would be inverted for southern hemisphere countries (i.e., the winter months would be defined as June, July and August, and the summer months as December, January and February).
While all years demonstrate increased seasonal mortality, Figure 1 also shows that some years have had exceptionally high seasonal mortality.
Global Seasonality
Geographic location is one of the most important drivers of the degree and direction of seasonal mortality. A company’s distribution of business by location could have a significant impact on their exposure to seasonality.
In Figure 2, monthly mortality data from the United Nations2 was used to create a Base 100 Index. The index’s purpose was to examine the differences in seasonal mortality among countries in the northern hemisphere, the southern hemisphere, and near the equator. (For this chart, the equatorial region was defined as limited to countries located within latitudes 20 degrees north and south of the equator.)
Not surprisingly the southern hemisphere’s seasonality curve mirrors that of the northern hemisphere. The seasonality curve is less dramatic for equatorial countries, as climate differences by season in this region are far less pronounced.
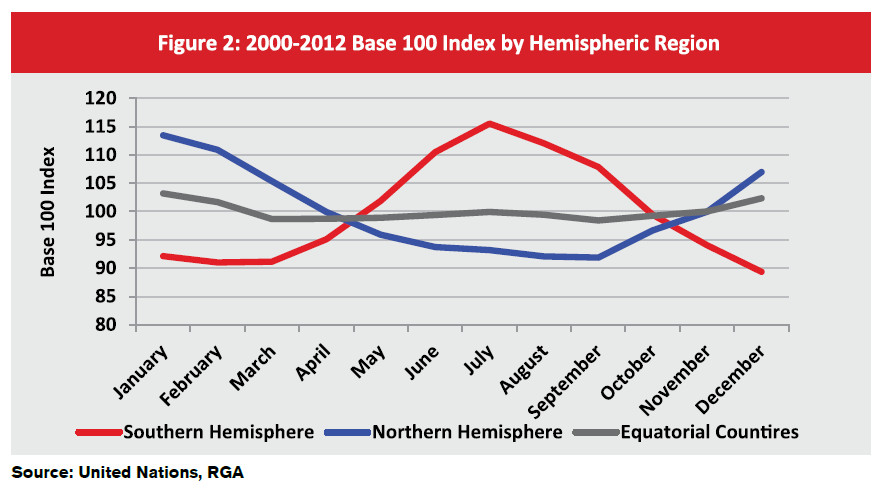
The Base 100 Index explains positive and negative variances of death counts across years relative to a trending average. Months with an index of 110, for example, have 10% higher mortality than the monthly average for that time period, whereas months with an index of 90 would have mortality that is 10% lower than the average trend.
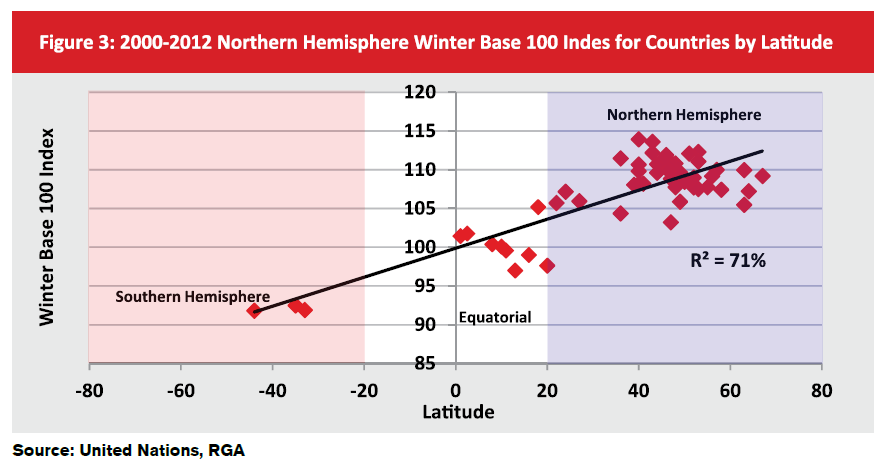
An additional assessment of seasonal variation by location explores the impact of distance from the equator. Figure 3 compares the average Base 100 Index for the northern hemisphere’s winter months of more than 50 of the world’s most populated countries to their median geographic latitude. Plotting the winter Base 100 Index against latitude yields the strong correlation shown below. If the southern hemisphere’s winter months were used for the chart, the same correlation would hold but with a negative sloping trend line. (Note that extreme northern countries, defined as those with latitudes around 70 degrees, appear to experience less seasonality relative to most countries at latitudes between 40 and 50 degrees.)
Flu and Pneumonia Seasonal Mortality and Other Causes of Death
Flu and pneumonia (F&P) mortality is the most winter-specific seasonal cause of death, followed by all other respiratory causes. Unnatural deaths such as suicide, accidents, and homicides are summer seasonal, i.e., these deaths tend to trend higher in the summer. The medical causes of death that are grouped broadly in Figure 4 are also winter seasonal, albeit not as significant as respiratory causes, with the exception of cancer.
Figure 4 demonstrates this by charting the winter-to-summer ratios for different causes of death in the U.S.
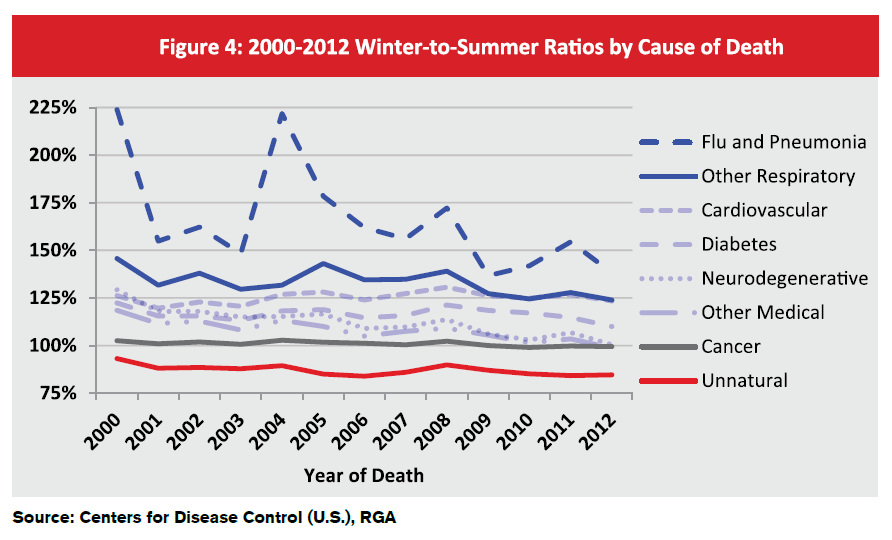
Figure 4 also sets the stage for identifying correlations and causations. The data suggests that flu and pneumonia are the most seasonal causes of mortality. Thus, it would be expected that in years with higher-than-normal F&P incidence, or where in the case of influenza there was poor vaccine match with circulating strain (as was seen in the 2014-2015 season), exceptionally high seasonal mortality could be experienced. Additionally, F&P involves a pro-inflammatory process, and inflammation is a driver in many other diseases, so this may explain seasonal mortality for causes of deaths other than respiratory. This observation is supported by Centers for Disease Control and Prevention (CDC)3 position on individuals at high risk for flu-related complications. The CDC lists asthma, neurological conditions, lung disease, heart disease, diabetes, kidney, liver, blood, and metabolic disorders, obesity, and weakened immune systems (e.g., HIV/AIDs and cancer) as conditions that heighten the risk for flu complications.
The only inconsistency between our data analysis and the CDC’s opinion is the conclusion with regard to cancer. Cancer patients, especially the terminally ill, tend not to exhibit seasonal mortality for a number of reasons, such as: more aggressive medical treatment; better nutrition; a strong support system; and increased sensitivity to factors that may prolong survival, such as immunizations and avoidance of crowds in winter4.
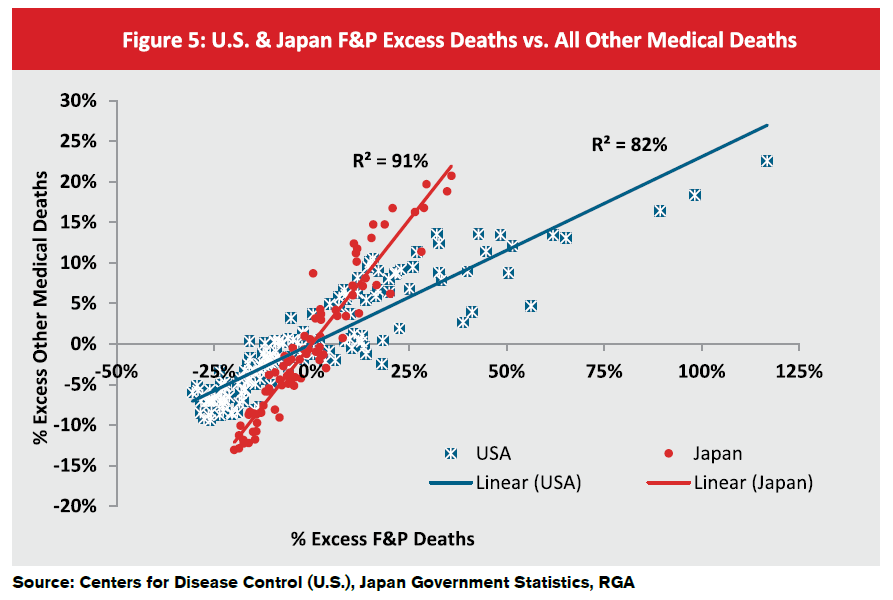
Figure 5 shows the correlations, or possible causal connections, between F&P mortality and overall winter seasonality for the U.S. and Japan. Using a scatterplot graph, it plots influenza and pneumonia deaths against all other medical deaths and compares the percentage of excess deaths that occur each month. (The percentage of excess deaths for a given month is defined as the additional number of deaths in a month relative to the trending average.)
Figure 5 demonstrates the positive relationship between increasing F&P deaths in the U.S. and increasing all other medical deaths. When fitting a linear trend line to the graph, the goodness-of-fit (i.e., the extent to which observed data match the trend line) is about 82%, signifying a strong correlation. The graph’s trend line also shows that all other medical deaths increase by about 20% to 25% of the increase of F&P deaths. For example, if F&P deaths exceed the norm by 40%, then all other medical deaths would exceed their norms by about 16% to 20%.
Figure 5 also shows data for Japan using the same methodology. Results look very similar, except the trend line’s goodness-of-fit is much stronger, at 91%. The trend line also implies that all other medical excess deaths increase by about 60% of what the F&P deaths increase. This is a much higher proportion than the U.S. and could be due either to the population density or other demographic characteristics. Lastly, Japan’s F&P excess deaths never exceed 35% while the U.S. exceeds 100%, which could mean that Japan’s F&P mortality is more controlled. (England and Wales data is not shown on this graph due to the differences in data availability.)
Unfortunately, identifying whether F&P mortality is not just correlated with seasonal mortality, but actually causes it, is very difficult to distinguish. Given, however, how significant the correlation is at the different deep-dives of the analysis, some level of causation might exist.
Implications for Insurers
The relationship between F&P mortality and seasonality has potential direct implications for insurance companies. As flu season predictions continue to evolve and improve, insurance companies may eventually be able to better prepare for seasonal as well as potentially adverse experience and financial results. This greater knowledge could also result in an enhanced understanding of how each individual company’s seasonality differs, based on their policyholders’ exposure to the complications of infectious diseases.
It is also important to understand the relationship between the seasonality of a general population and that of insured lives. For insured lives, the latter is typically much less significant than the former for a variety of reasons, including: 1) age demographics that skew younger for insured lives; 2) the generally higher socioeconomic status of policyholders and their better access to health care; 3) volatility of claim size; and 4) lags in claim reporting1.
An understanding of seasonality can also be quite valuable when interpreting partial year claims experience analyses. Results are often skewed by external stimuli such as seasonality. Underwriters or medical directors who utilize an experience study to make decisions need to bear such factors in mind.
The most interesting aspect of the implications of seasonality for insurance companies is that there is still much to learn. Currently, forecasting and predicting F&P seasonality are still in their infancy. When forecasts become more accurate, insurance companies will have a new tool to monitor and analyze seasonal claims experience. Eventually there might even be new ways for companies to mitigate seasonal risk to their earnings. This is an area of great interest to insurers, and will undoubtedly receive more attention and research in the future.


