Reasons to monitor US population mortality
US population mortality datasets are sizable and updated regularly. They contain granular details such as date of death, age at death, and cause of death information, and are readily and freely available. As the US records around 3 million deaths per annum, the data offers an advanced and credible perspective on short-term mortality.
During the height of the COVID-19 pandemic, monitoring excess mortality in real-time provided a comprehensive view of the pandemic’s impact beyond confirmed COVID-19 deaths and a better understanding of the crisis’ true toll. The excess death data included deaths indirectly caused by pandemic-related factors, such as disruptions to healthcare systems and economic hardships, and the longer-term effects of COVID-19 infection.
In the current post-pandemic era, the observed short-term changes in excess mortality are offering insight into medium-term and possibly longer-term changes. These insights can be used as inputs to create frameworks, principles, and approaches to set future mortality assumptions. They can also be used to validate outputs from the given frameworks and estimates provided by actuarial associations. Such insights have always been critical for pricing protection business and annuities but have become more important than ever as the industry emerges from the COVID-19 pandemic.
In this brief video, RGA's Micah Canaday, Vice President of Americas Data Solutions, explains how RGA is using CDC population mortality data to derive insights into medium-term and possibly longer-term changes.
How to monitor US population mortality
Monitoring emerging mortality experience requires three essential components: up-to-date death data, exposed-to-risk (exposure) data, and some expectation of mortality against which observed mortality can be measured.
The US Centers for Disease Control and Prevention (CDC) National Center for Health Statistics (NCHS) provides authoritative US death data. Finalized death data through year-end 2022 is currently available from the CDC NCHS Vital Statistics Online Data Portal.2 Provisional and incomplete death counts are available from CDC NCHS’s mortality data via CDC’s Wide-Ranging ONLine Data for Epidemiologic Research (WONDER),3 the CDC portal for public health data, through the end of the prior week. Data are based on death certificates for US residents; each death certificate contains a single underlying cause of death, up to 20 multiple causes of death, and a myriad of demographic data. Death counts from CDC WONDER can be obtained pre-stratified by several variables, including place of residence (total US, region, state, and county), age group (including single-year-of-age cohorts), gender, date of death, place of death, and cause of death.
Users must exercise care and judgment when using the latest mortality data from WONDER. (See “Considerations for death data” in this paper for more on this.)
Raw death counts provide minimal value without exposure data. Exposure data must correspond to death data or be adjusted accordingly. The US Census Bureau (USCB),4 the official arbiter of national population numbers, provides both population estimates and projections, which can be used to develop exposure estimates. Alternative population estimates are available from other sources, but those estimates require careful review to ensure they correspond to the death data and cover all age ranges.
It is important to note that the USCB revises population estimates periodically as new data becomes available and methods are refined. Because of this, both population and exposure estimates can change, and results may change accordingly. By fall of 2024, the USCB expects to release the 2010 to 2020 Intercensal Estimates – the official population estimates for the 2010-2020 decade .
Understanding how current mortality has changed compared to pre-pandemic expectations requires an expected mortality basis, i.e., some form of expected mortality, against which to measure. Expected mortality is critical to determining excess mortality and its likely trajectory. (Considerations for expected mortality are explored later in this article.)
Understanding changes in the drivers of mortality requires identifying underlying causes of death and breaking down expected mortality by cause. The cause definitions in the expected basis must align with the cause definitions in the death data to ensure they are comparable. This may sound obvious and straightforward, but anyone who has tried to reconcile causes of death across multiple International Classification of Disease (ICD) versions knows it is neither.
Considerations for death data
Just as there are incurred but not reported/recorded (IBNR) claims in the insurance world, there are IBNR deaths in the death data from WONDER. The reason for this is that the death data from WONDER are provisional: It can take several weeks for death records to be submitted to the NCHS, processed, coded, and then tabulated. Consequently, provisional data may be incomplete, especially for more recent time periods. Death counts for the latest weeks are revised regularly, and may increase or decrease, as data from new and updated death certificates are received. Importantly, for recent periods, death counts in WONDER data are incomplete and not the counts that will ultimately be observed; the CDC does not gross up initial values for IBNR deaths to estimate where they might ultimately land, and such estimates are not readily available.
Actuaries (and other like-minded professionals) can develop reasonable gross-up factors through relentless data collection and tracking how initial death counts progress over long time frames. Importantly, this data monitoring and later data interrogation allows the application of sensible confidence intervals to recent estimates. Estimating IBNR requires a deep understanding of how death data are reported.
Considerations for expected mortality
Quality and robust expected mortality rates are critical for useful analyses. They will determine excess deaths where:
Excess deaths = Reported deaths + IBNR deaths - Expected deaths
The expected deaths are what, before the pandemic’s onset, would have been anticipated for the current period, but still allowing for improvements (and seasonality if needed).
For interested readers, this section sets out considerations for setting expected mortality rates.
A typical approach to setting expected mortality rates is to set base mortality rates, then overlay estimated and projected improvements, and then overlay seasonality adjustments if the analyses are at a monthly or weekly level. This approach is useful for setting expected rates for both all-cause mortality and specific causes of death. It is necessary to consider how to group different causes in the data when setting expected rates by cause; less significant causes of death have mortality rates too volatile to work within this type of analysis.
Mortality improvements must also be included to allow for a realistic view of any excess mortality that needs to be understood and explained. This more complete view informs the insights drawn from even short-term mortality changes and trajectories.
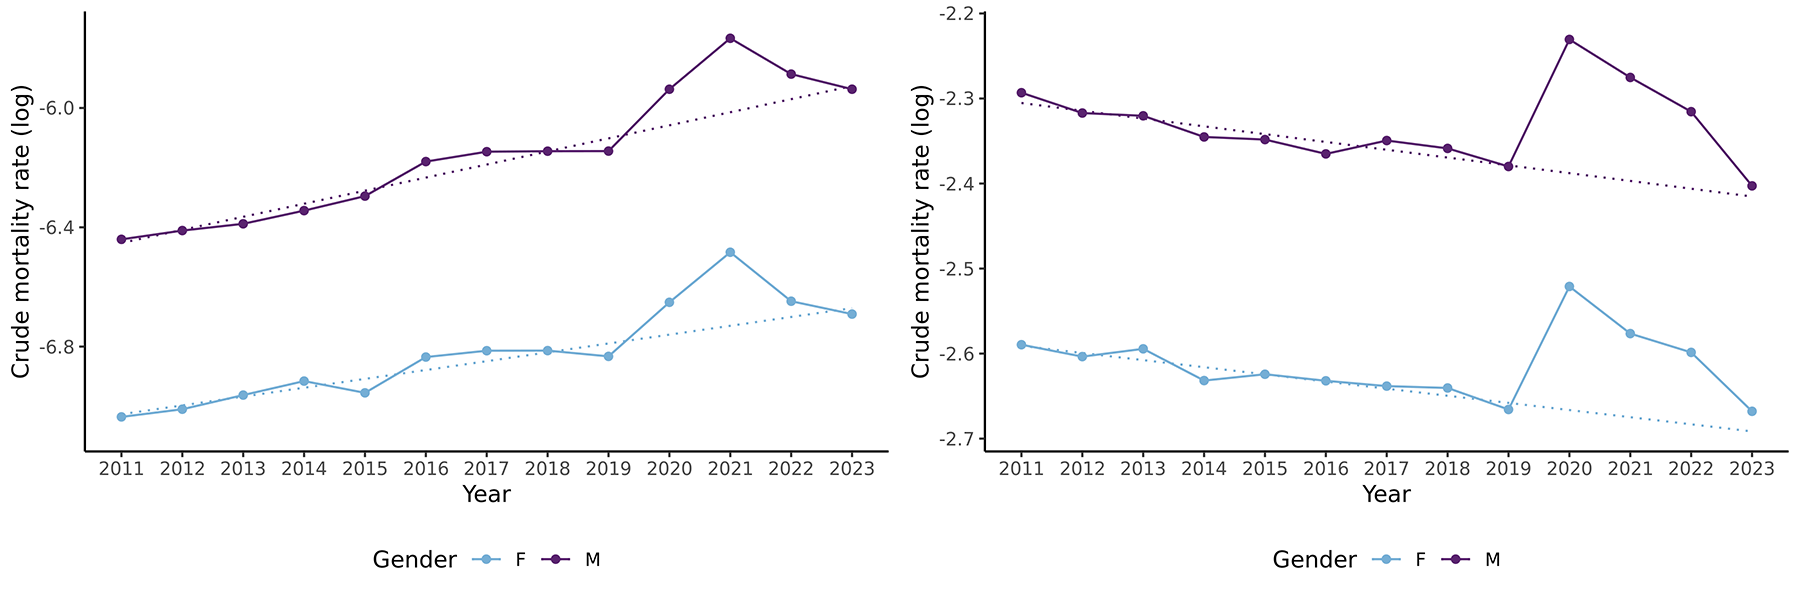
The graphs show the (log) crude mortality rates (dots joined with solid lines) for all-cause mortality for lives age 35 (left) and 85 (right) by gender and calendar year for the period 2011-2023 in the U.S. The dotted lines show the linear trends for the period 2011-2019 extended through to 2023.
Estimates from the Society of Actuaries’ Mortality Improvement Model could be used for all-cause mortality.5 But wherever or however derived, it is important to ensure that improvements are aligned with base mortality rates and the data used.
Mortality improvements will also vary by cause. Setting by-cause improvement assumptions will require judgement and pragmatism where the death data is sparse.
Death data from CDC WONDER is available at annual, monthly, and weekly resolutions. The analyses carried out by RGA use a monthly resolution. This requires including seasonality adjustments in the expected basis, as significant seasonality is frequently observed at monthly levels in the US.
Seasonality varies by age and is most pronounced for older lives for all-cause mortality, as illustrated in Figure 3 for all-cause mortality. That said, seasonality can be observed for younger lives when mortality is broken down by cause. For example, Figure 4 shows crude mortality rates for “other accidents” (non-transport accidents) and reveals elevated mortality for younger lives in the summer months.
Figure 3: Seasonality in all-cause mortality for males and females at ages 35 and 85 for 2011-2019
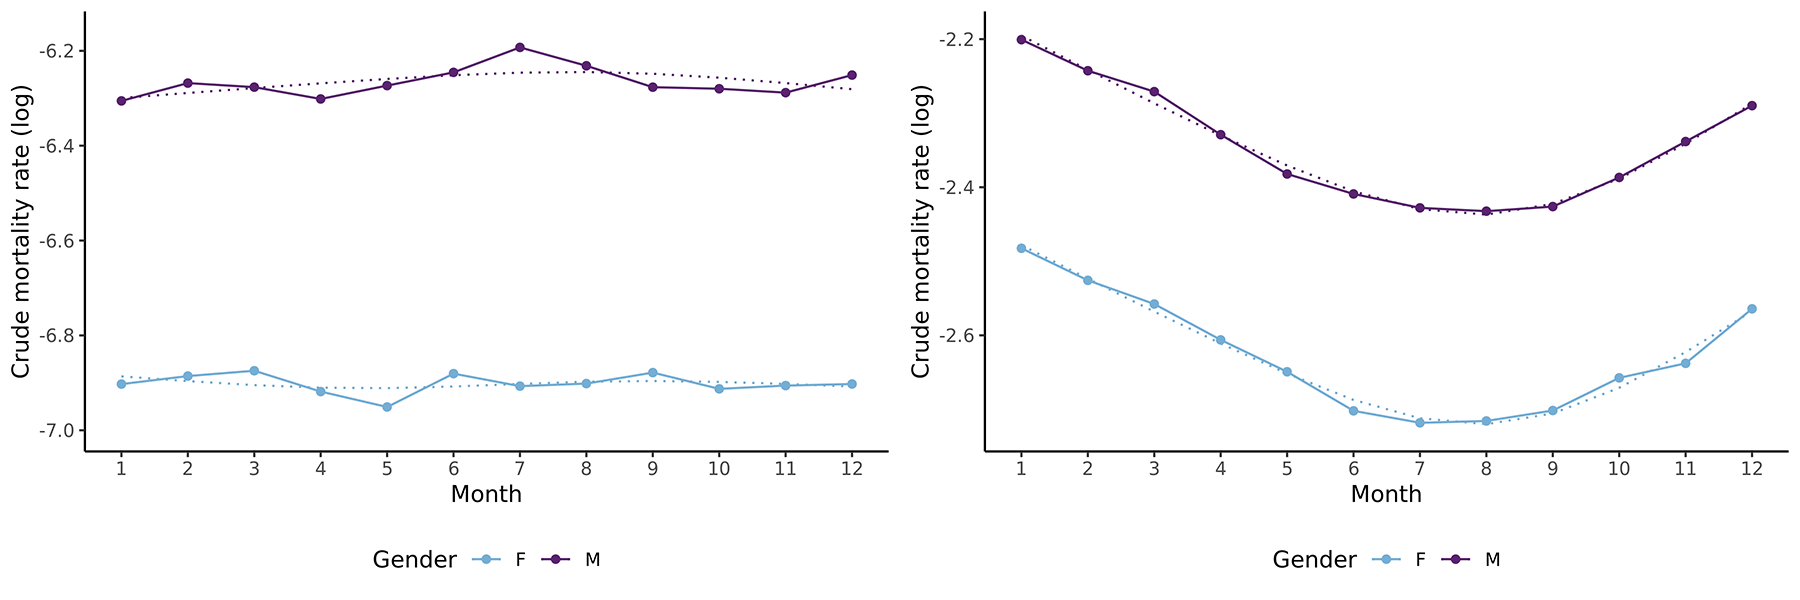
The graphs show the annual all-cause (log) crude mortality rates (dots joined by solid lines) by calendar month for lives aged 35 (left) and 85 (right) for both genders for the period 2011-2019 in the US. Smoothed curves are given by the dotted lines.
Figure 4: Seasonality in “other accident” mortality for males and females at ages 35 and 85 for 2011-2019
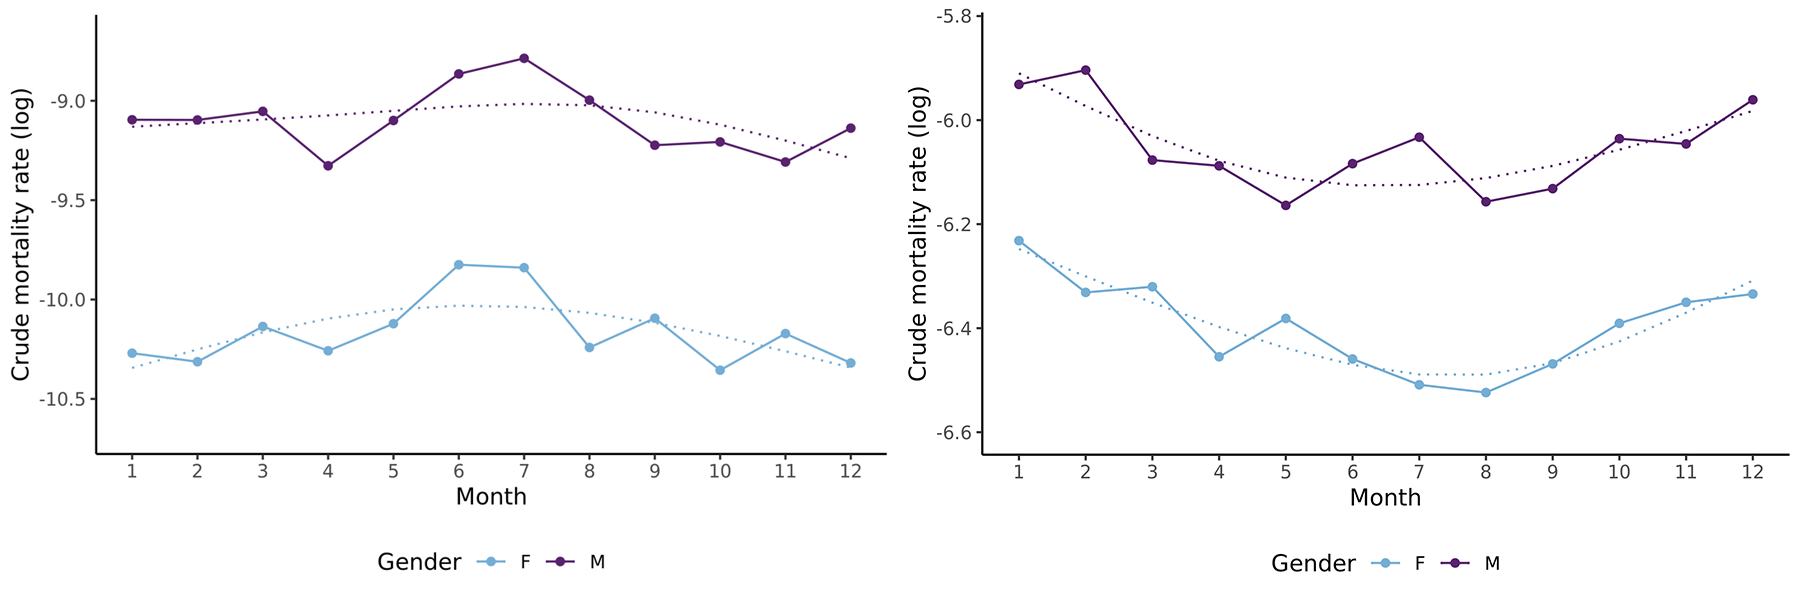
The graphs show the annual (log) crude mortality rates (dots joined by solid lines) for the “other accident” cause of death by calendar month for lives aged 35 (left) and 85 (right) for both genders for the period 2011-2019 in the US. Smoothed curves are given by the dotted lines.
The analyses that underlie the forthcoming full report use a pre-pandemic expected basis developed from the data described above. The expected bases are for all-cause and by-cause, and in all cases make allowances for improvement trends and seasonality. The improvements capture the trends observed in data and mortality rates are projected out for 2020 to 2024 with these trends.
Extracting insured life insights
Extracting insights for insured lives is a significant challenge when considering population-level mortality results. In many countries, for varied reasons, but notably underwriting, insured lives can have significantly different mortality levels from those of the general population. The differences in mortality among insured lives may also vary depending on the product and the provider.
To translate population-level mortality insights into insured life insights requires a thorough understanding of a carrier’s book of business. Even then, appreciable uncertainty may remain and mandate the use of judgment.
US population mortality data is a valuable data source. Challenges translating population-level insights to insured insights and to other countries are unavoidable given the US’s unique characteristics, such as its obesity epidemic, widespread opioid abuse, and lack of universal healthcare. That said, with the right data and approach, US population mortality can be a key source of granular and current mortality experience, and the emerging US results may provide leading insights into mortality trends in insured lives applicable to multiple markets.
Ready to dig deeper? Visit RGA’s US mortality report page.