Abstract
- The prevalence of pediatric overweight and obesity has surged over recent decades and poses a critical public health challenge worldwide.
- The World Health Organization (WHO) recognizes this surge as a global epidemic, and the American Medical Association labels pediatric obesity (and obesity in general) as a chronic disease.
- In response, the American Academy of Pediatrics (AAP) released its first clinical practice guidelines for the evaluation and treatment of pediatric obesity in January 2023.
- The guidelines provide an alternate classification for severe obesity, advocate for early intervention and rigorous screening for associated comorbidities, and expand treatment options to include pharmacotherapy and, in severe cases, bariatric surgery.
Case presentation
A mother applies for a $350,000 whole life insurance policy for her 16-year-old son. His build (height: 72 in/183 cm; weight: 253 lbs/115 kg; BMI: 34.3) is above the underwriting manual reference range, and the case is referred to the medical director. According to the US Centers for Disease Control and Prevention (CDC) Child and Teen BMI Calculator,1 the young man’s BMI is in the 98th percentile – equivalent to 124% of the 95th percentile. Additional history indicates he has acanthosis nigricans, blood pressure of 139/74, hemoglobin A1c of 5.8, and total cholesterol of 215 mg/dl/5.6 mmol/L – all of which provide additional cause for concern.
Unfortunately, such cases have become increasingly common, and it is important for insurance medical directors and underwriters to monitor pediatric overweight and obesity and to understand the risks these conditions present.
Prevalence of childhood and adolescent obesity
The World Health Organization (WHO) reports that pediatric obesity rates have risen dramatically, from 8% in 1990 to 20% in 2022, with an estimated 390 million children and adolescents ages 5-19 years being overweight.2 In the US, the CDC approximates that 14.7 million children are obese.3 The childhood obesity rate in the US increased from 5% in 1963-1965 to 19% in 2017-2018,4 and the rate of BMI increase in children approximately doubled during the COVID-19 pandemic, from 0.052 kg/m2/month before the pandemic to 0.100 kg/m2/month during the pandemic.5
If this trend persists, predictive epidemiologic models estimate that more than half (57%) of US children ages 2-19 will be obese by the time they are 35 years of age, in 2050.6
In January 2023, the AAP published its first edition of evidence-based clinical practice guidelines for the evaluation and treatment of pediatric obesity. It encourages earlier and more aggressive interventions and treatments, including intensive behavior and lifestyle counseling, pharmacotherapy, and bariatric surgery.
Use of BMI as a screening and diagnostic tool
The AAP recommends annual obesity screenings for children and adolescents aged 6 years and older. While BMI does not directly measure fat content, it remains a validated proxy measure for diagnosing overweight or obesity. In the US, the CDC has developed BMI-for-age growth curves as a diagnostic tool. While these growth charts encompass ages 2-19, practitioners can consider a transition to adult BMI calculations and categorization for those older than 18 years. For children under age 2, the CDC recommends using the WHO’s weight-for-length, age-, and sex-specific charts to track weight status.
Unlike the cut-points used for adult categories, the CDC’s BMI interpretation in the pediatric population is age- and sex-specific and expressed as a percentile. For example, a BMI of 23 is considered obese for a 10-year-old boy but healthy for a 15-year-old boy (Figure 1).7
Figure 1: CDC BMI-for-age percentiles for boys.
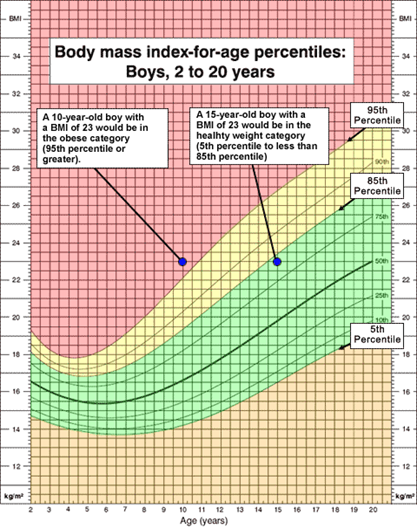
Because the 2000 CDC BMI-for-Age Growth Charts are based on data from 1963-1980, when the prevalence of obesity was much lower, they are not recommended for use in children with extremely high BMI values, i.e., above the 97th percentile. In 2022, the CDC released the Extended BMI-for-Age Growth Charts based on additional data from 1999-2016 and updated statistical methods, with BMI percentiles up to the 99.99th percentile (Figure 2).8
Figure 2: 2022 CDC extended BMI-for-age growth charts for boys and girls.
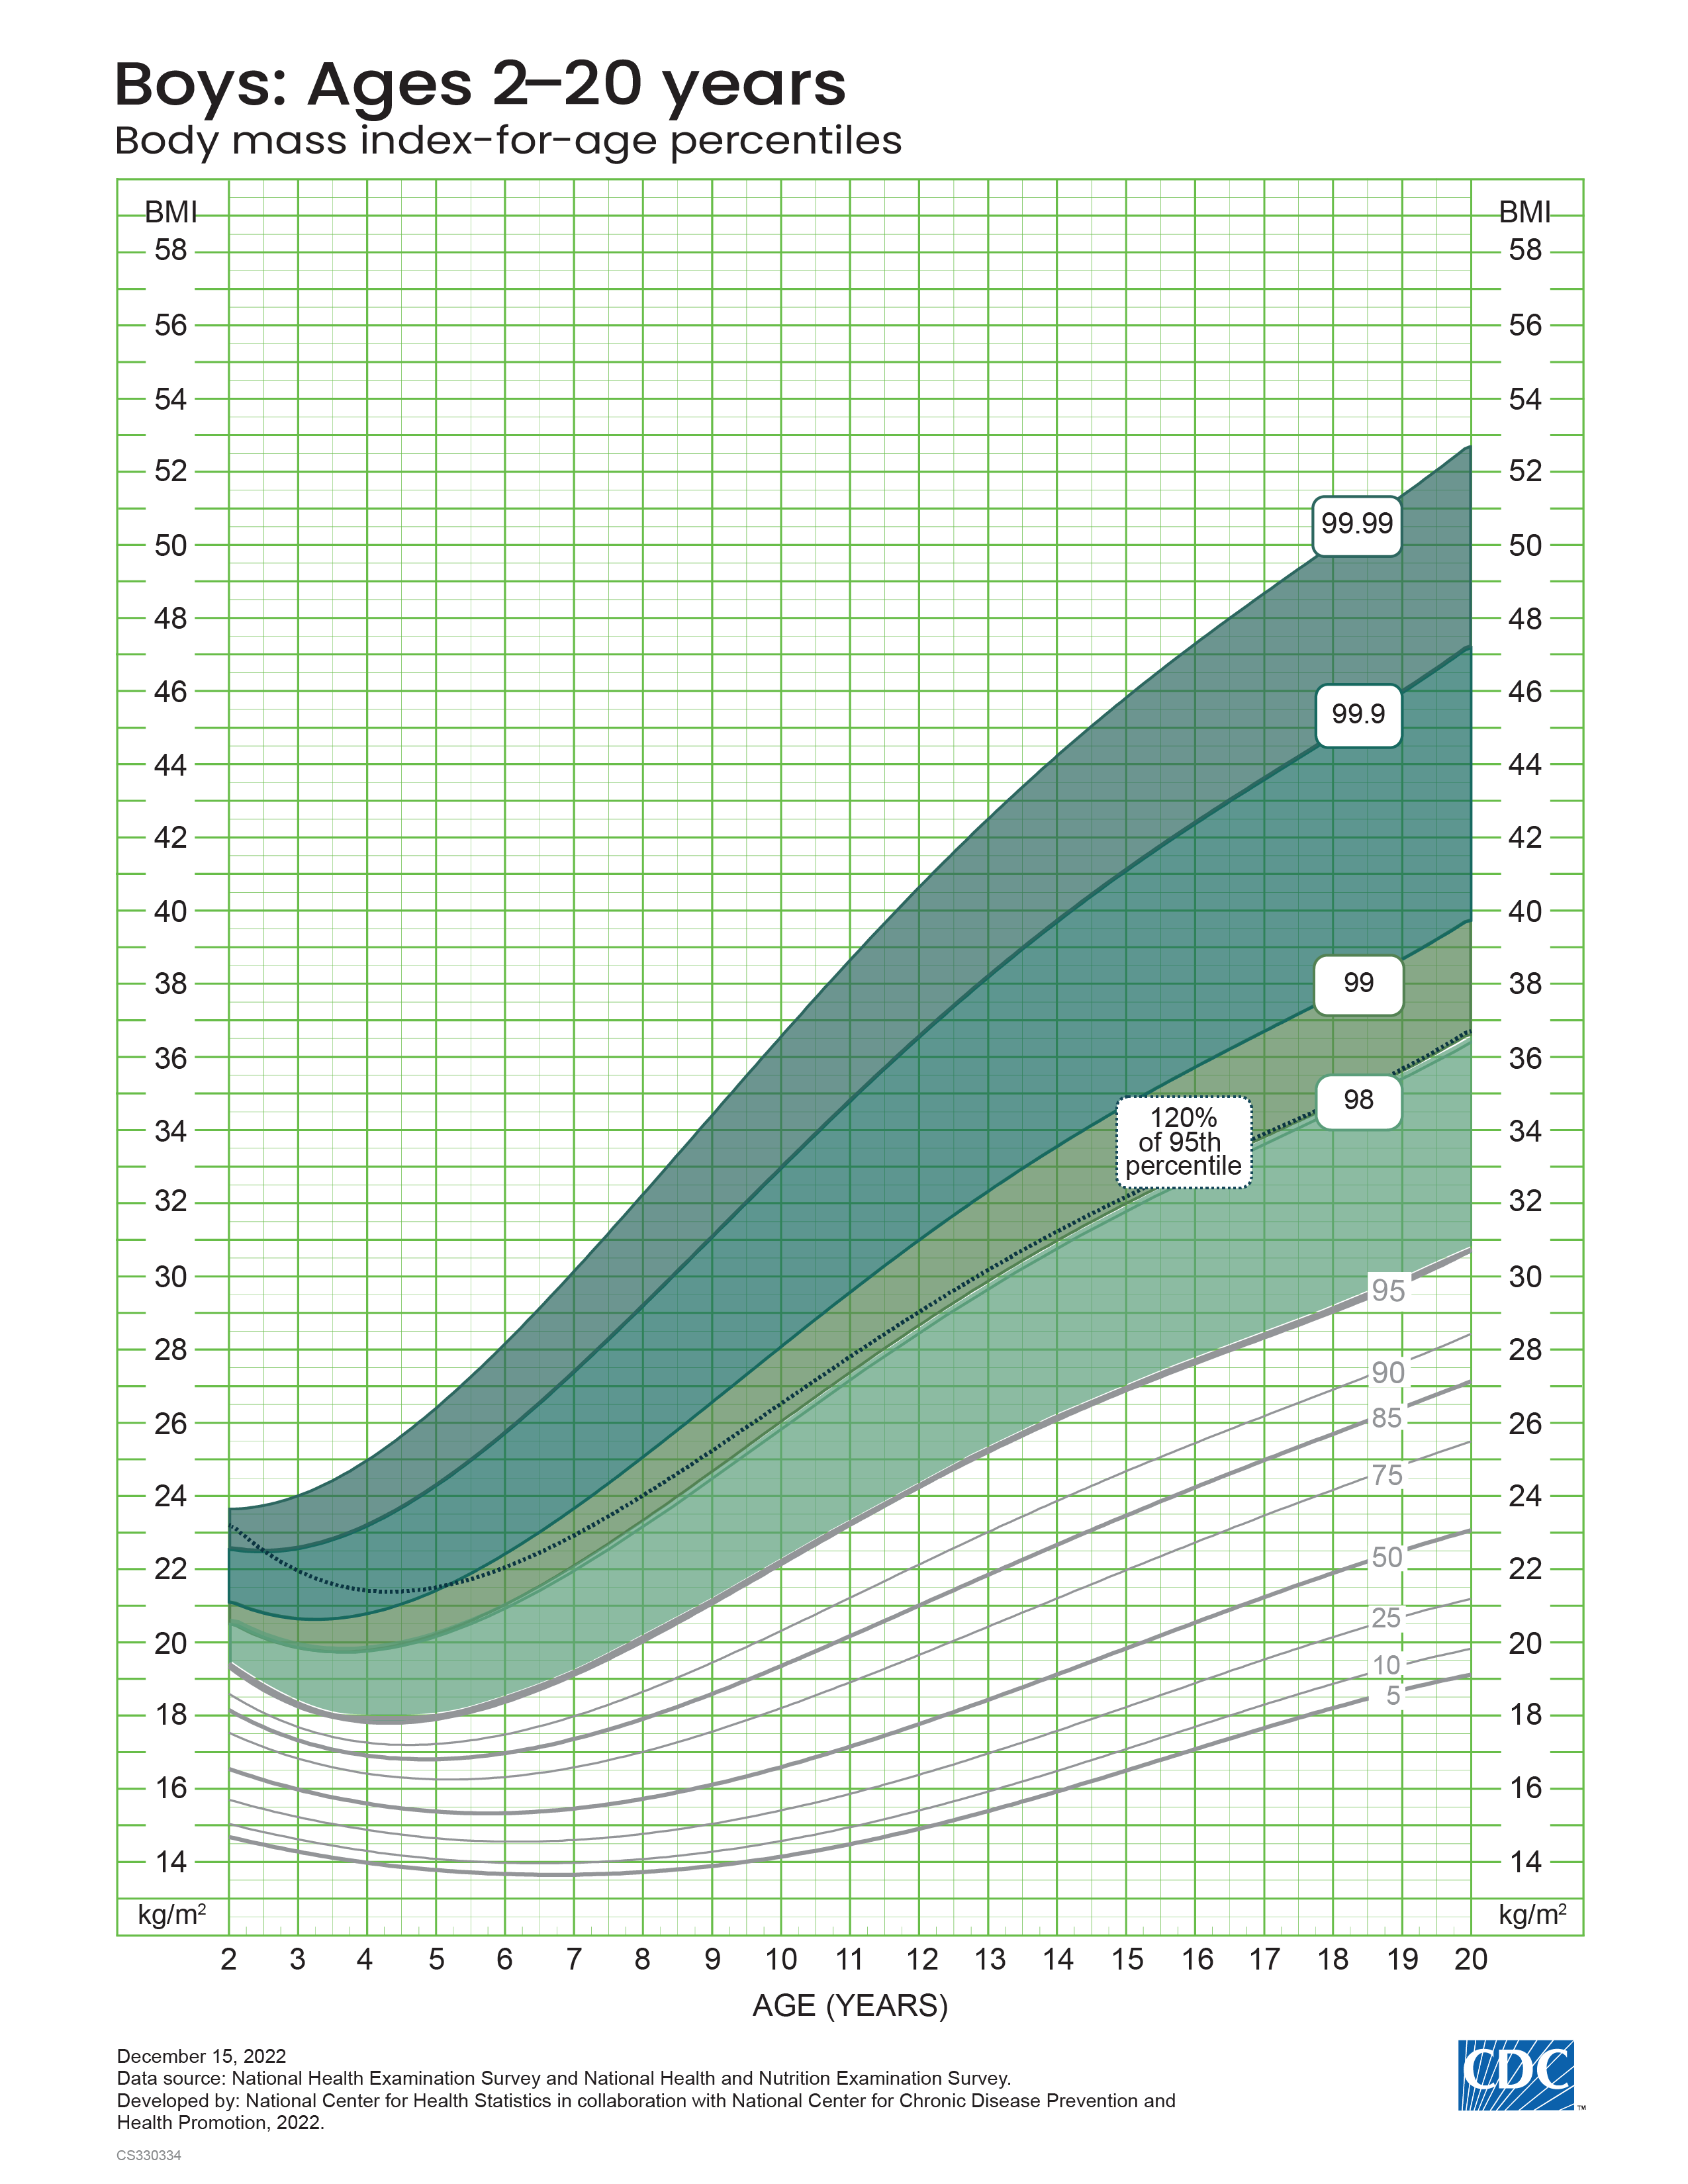
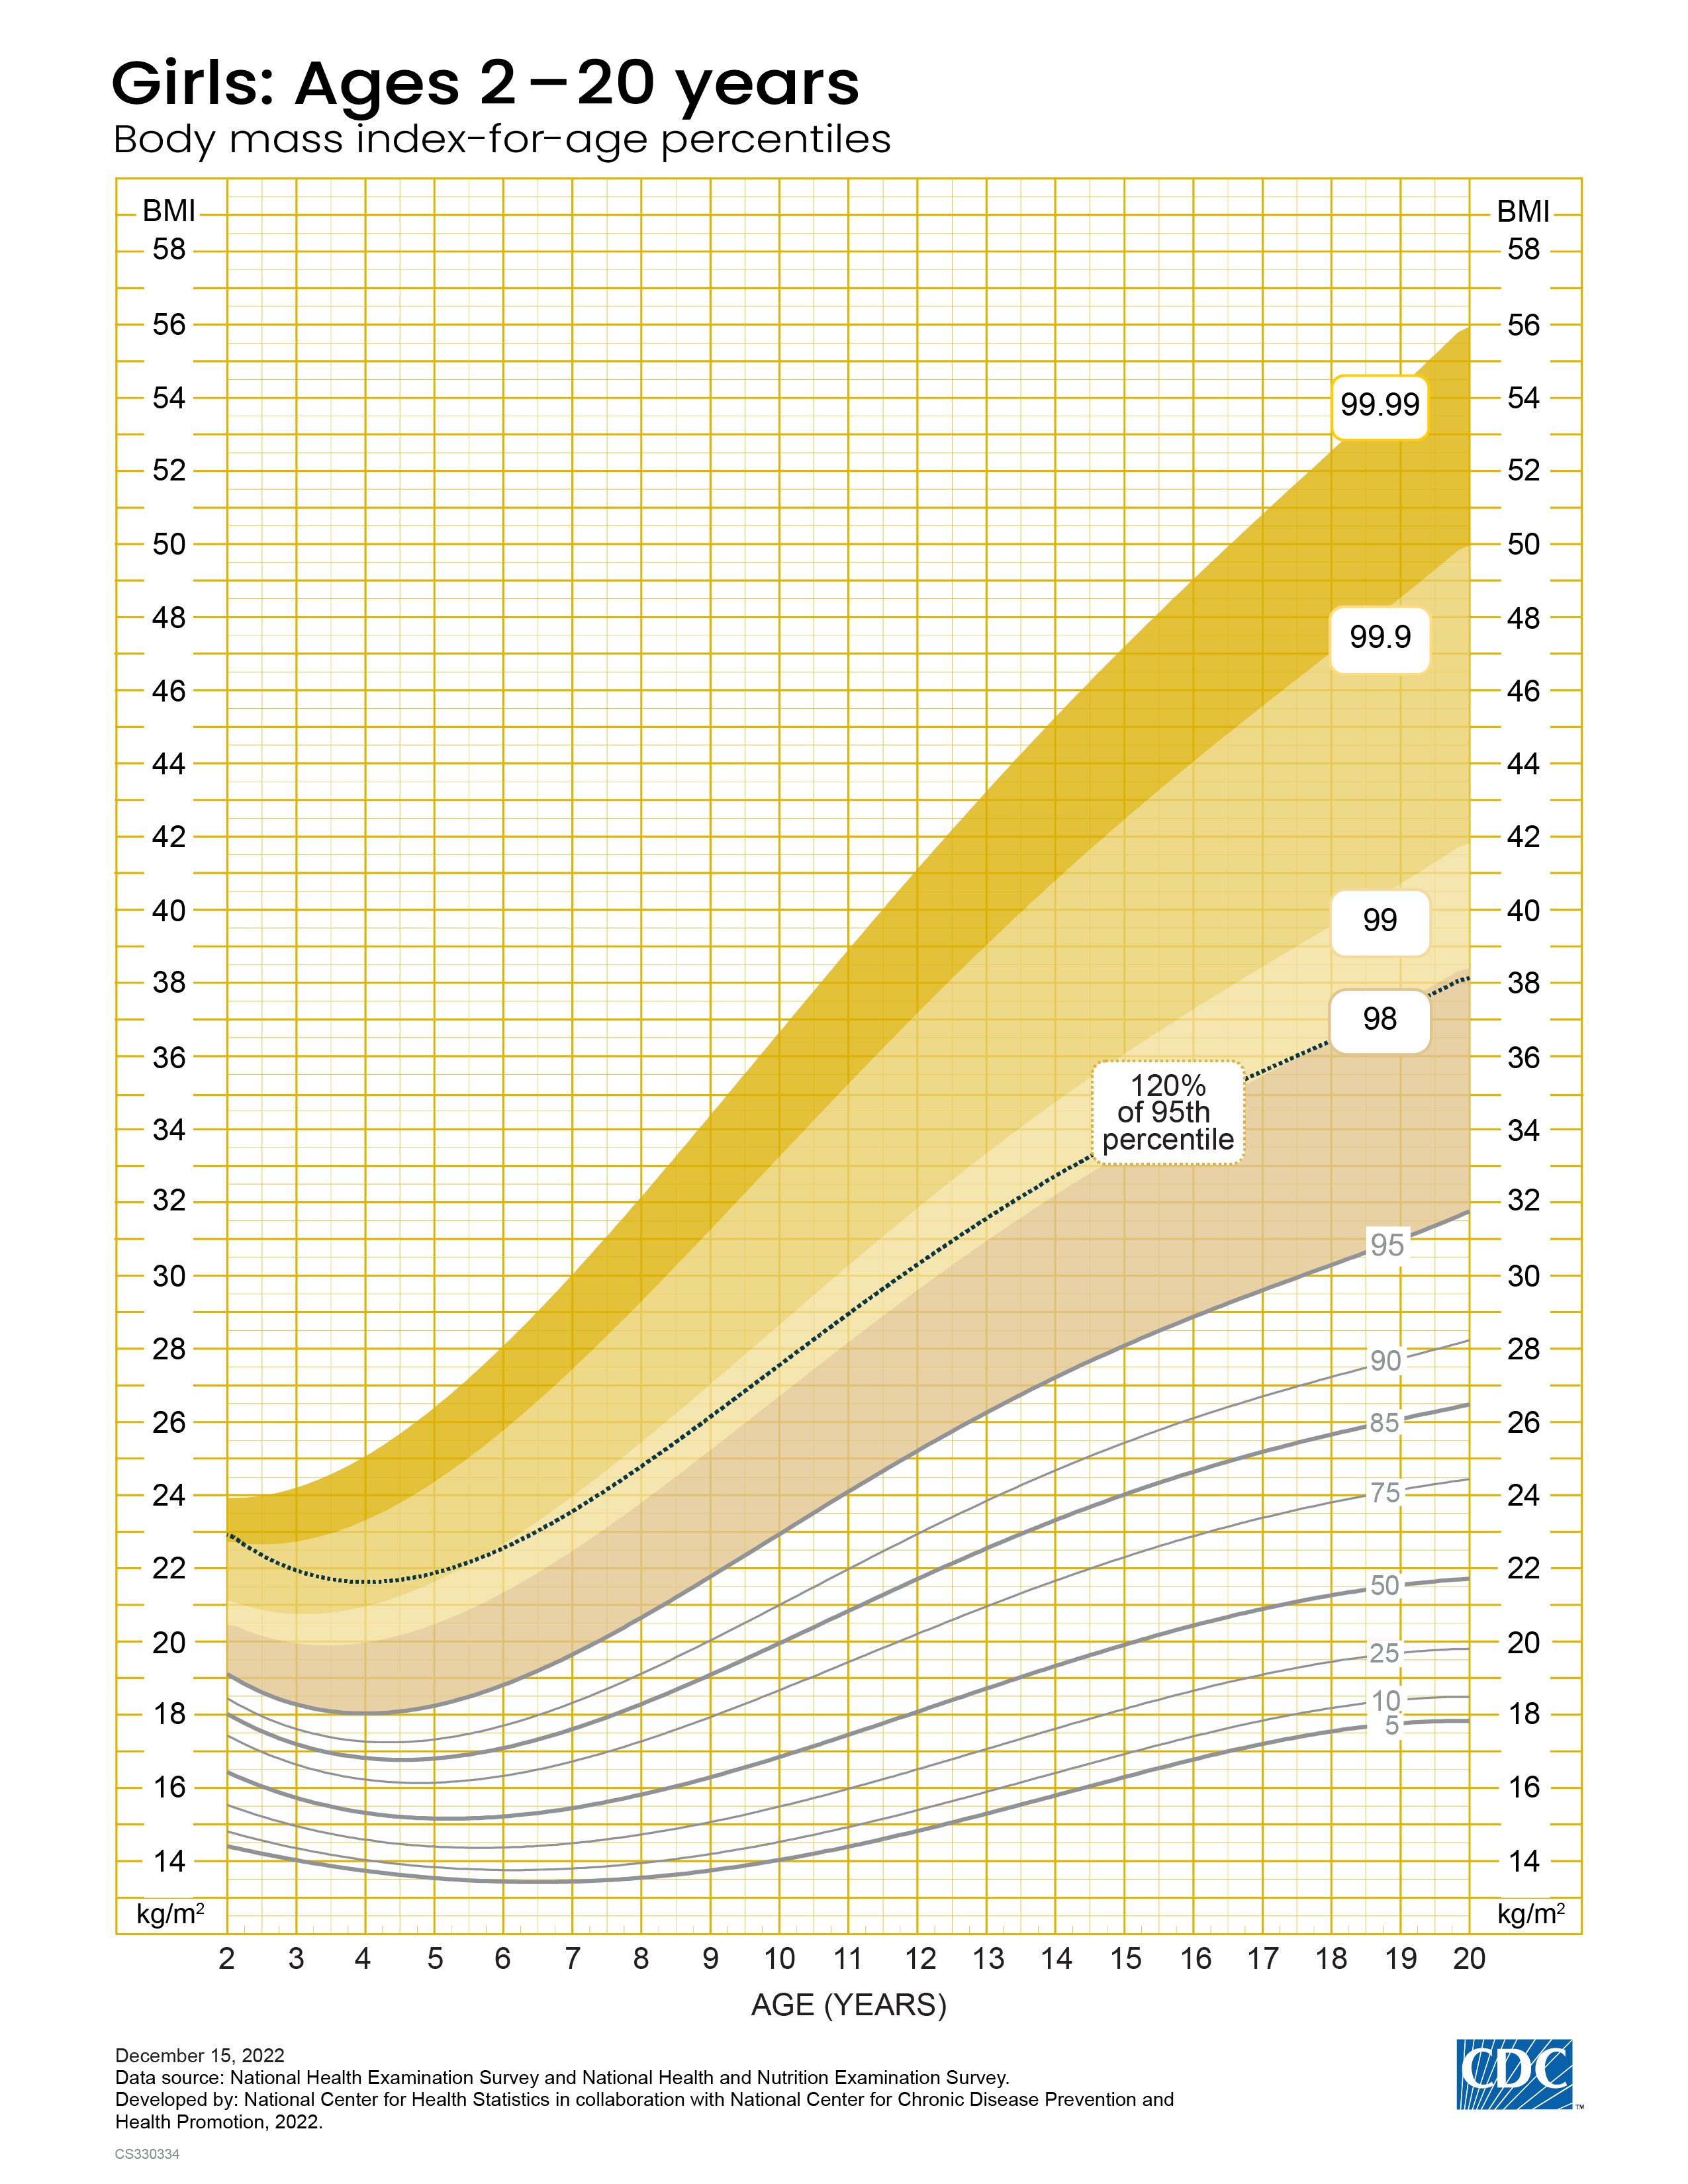
Extrapolation of percentiles beyond the 97th percentile may generate unusual or unexpected results. Therefore, the AAP guidelines suggest using the degree to which a particular BMI percentile is above the 95th percentile to indicate different levels of severe obesity (referred to as percentage above the 95th percentile).
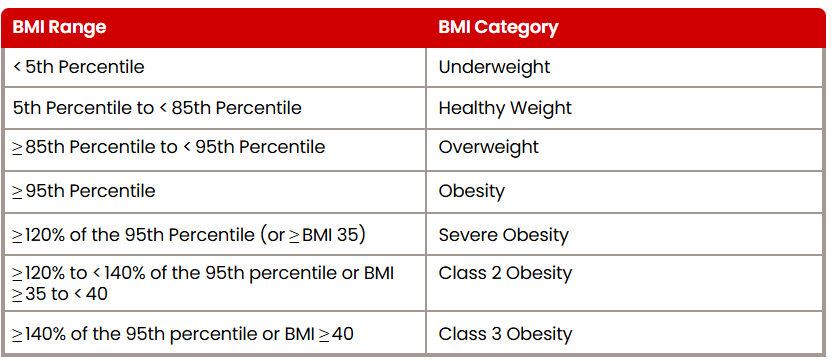
Overweight is defined as a BMI ≥ 85th percentile, obesity is BMI ≥ 95th percentile, and severe obesity is BMI ≥ 120% of the 95th percentile. Severe obesity is further divided into class 2 obesity, which is ≥ 120% to <140% of the 95th percentile, and class 3 obesity, which is ≥140% of the 95th percentile.9
Table 1: Child BMI categories and the corresponding sex- and age-specific BMI percentile ranges.
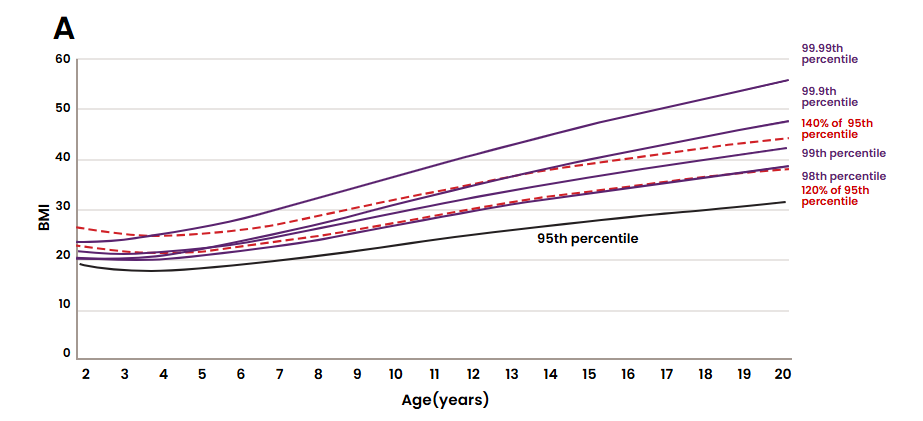
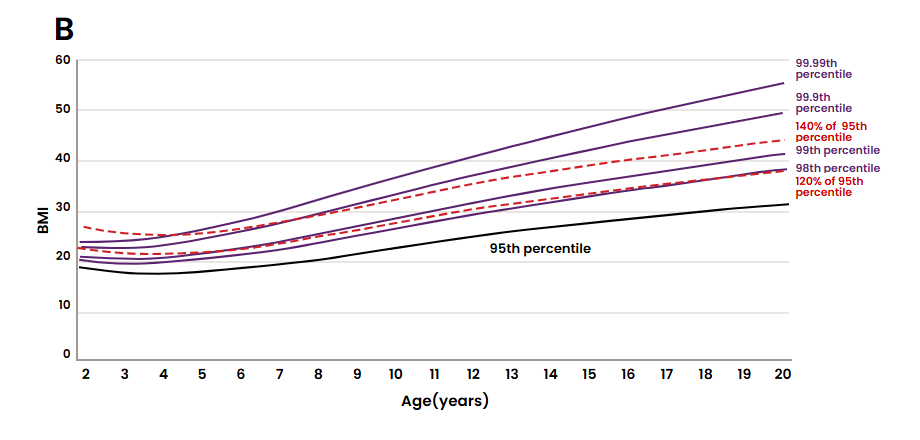
How does this categorization compare to the 2022 CDC Extended BMI-for-Age Percentile growth curve? Ogden et al. showed that at younger ages, around 2-6 years, 120% of the 95th percentile is higher than both the extended 98th and 99th BMI-for-age percentiles. However, for ages 7 and older, 120% of the 95th percentile approximates to the extended 98th percentile, and the percentage of adolescents ages 12-19 years with BMI ≥ 120% of the 95th percentile is virtually the same as those with ≥ 98th percentile (Figure 3).10
Figure 3: Select CDC extended BMI-for-age percentiles, 95th percentile and 120% and 140% of the 95th percentile, (A) girls and (B) boys. Note: Percentiles above the 95th percentile are CDC extended BMI-for-age percentiles.
Impact of Pediatric Obesity
Obesity puts juveniles at risk for serious adverse health outcomes, including hypertension (HTN), dyslipidemia, insulin resistance, type 2 diabetes mellitus (T2DM), nonalcoholic fatty liver disease (NAFLD), and cardiovascular disease, among others.
Insulin resistance varies across weight categories and is highest among children with severe obesity. Based on 2005-2016 NHANES data, prediabetes is observed in one out of five adolescents ages 12-18.11 The transition from prediabetes to T2DM occurs faster in children than in adults, within 21 months in children compared to 5-10 years in adults.12 The projected fractions of adult-onset T2DM due to high adolescent BMI (≥85th percentile) are 56.9% in men and 61.1% in women.13 Furthermore, insulin resistance increases oxidative stress and inflammation, elevating the risk of NAFLD, which is estimated to be as high as 34% in children with obesity.9 According to a 2009 study, children with NAFLD experience higher rates of mortality over a 20-year period compared to the general population of the same age and sex.14 The health risks carry into adulthood through increased cardiovascular mortality. In a study of 2.3 million adolescents, even high-normal range BMI (75th to 84th percentile) produced hazard ratios of 2.2 for coronary heart disease and 1.8 for total cardiovascular causes.15
Higher BMI is also associated with obstructive sleep apnea (OSA), which is found in 45% of children with obesity compared to 9% in children with healthy weight.9 A cross-sectional study of overweight and obese children ages 7-18 showed that a one unit increase in BMI standard deviation score increases the odds of having OSA by a factor of 1.92, independent of age, sex, tonsillar hypertrophy, and asthma.9
Pediatric obesity is thought to be associated with depression, although the relationship is less understood. A 2019 systematic review and meta-analysis reported the odds of developing depression are 1.32 higher in obese children in general and 1.44 higher among obese female children compared to their normal-weight counterparts.16
Other comorbidities associated with pediatric obesity include polycystic ovarian disease, idiopathic intracranial hypertension, and orthopedic disorders due to mechanical stress, such as slipped capital femoral epiphysis and Blount disease.
Initial studies assessing mortality related to pediatric obesity are limited due to their size, and because mortality is low during adolescence and early adulthood, more accurate assessment requires long-term follow-up. Nevertheless, some studies indicate a higher mortality risk. A 32-year follow-up study in 2002 involving 227,000 Norwegian adolescents ages 14-19 shows an increased risk of death for both males and females with higher BMI percentiles during adolescence. The relative risk (RR) of death for males is 1.29 for the 85th to 94th percentile and 1.82 for the ≥ 95th percentile. The RR of death for females is 1.31 for the 85th to 94th percentile and 2.03 for the ≥ 95th percentile.17


