Is the heartbeat underrated?
Most underwriting manuals have not yet leveraged the potential predictive power of several features of heart rate. In this article, we take an in-depth look at the most important features, including resting heart rate (RHR), heart rate recovery time after exercise, and heart rate variability. We also review key mortality studies and consider the practical underwriting challenges of using such data for risk assessment.
Resting heart rate: Live fast, die young
While medical textbooks consider a normal RHR to be about 50-90 beats per minute, underwriting guidelines typically allow for a wider range. This is because an RHR taken during a typical medical insurance examination may not represent a true resting rate. It can be affected by a variety of factors such as anxiety, dehydration, caffeine and nicotine. Underwriters, understandably, have shown reluctance to use a single isolated RHR unless it is severely abnormal.
However, with today’s greater availability of serial RHR data from wearable devices and electronic health records, underwriters now have much better access to reliable long-term RHR data. Serial readings give underwriters more confidence that the RHR recorded within an attending physician statement is representative of typical measurements for the individual. Access to such data could now make RHR an attractive biometric to help stratify insurance applicant risk.
The underlying physiological mechanism of the relationship between RHR and life expectancy can be explained by several factors, including metabolic rate, autonomic nervous activity and inflammatory processes. For example, Boudoulas et al. (2015) assert that a fast RHR directly affects the cardiovascular system and can result in arterial stiffening.1
Numerous studies have shown an increased RHR is a reliable predictor of cardiovascular and all-cause mortality. This association is independent of both cardiovascular impairments and risk factors.
Mortality data for resting heart rate
The association between RHR and life expectancy is well established in the medical literature. Here we report on recent studies to illustrate the strength of this association.
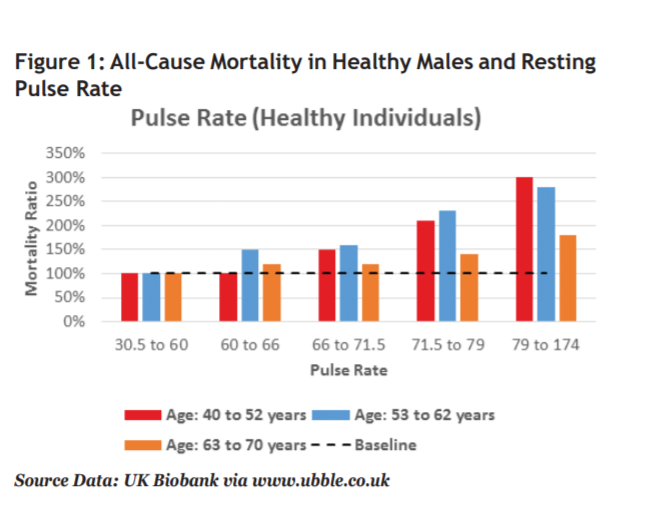
Figure 1 is based on data from the UK Biobank for 159,769 healthy males who had a median follow-up period of 5 years.2 The data demonstrate that an increased pulse rate is associated with excess all-cause mortality relative to a benchmark of healthy individuals with pulse rates below 60. The mortality risk is relatively higher at younger ages, making this metric particularly relevant for insurance underwriting. We note a similar trend is present in females as well.

Table 1 provides a summary of studies from the medical literature demonstrating a relationship between RHR and life expectancy.
Table 1: Resting Heart Rate Mortality Data
| Study | Description | Findings |
|---|
| Melbourne Collaborative Cohort Study, Seviiri M et al. (2017)3 | 21,692 participants, 21.9 years follow-up | Hazard ratio (HR) for a 10 beat-per-minute increase in RHR was 1.13 (95% confidence interval (CI) 1.11- 1.15) for all-cause mortality. |
| Systematic review and meta-analysis, Aune D et al. (2017)4 | 87 studies, 1.8 million total participants | Relative risk reported for a 10 bpm increase in RHR was 1.17 (95% CI 1.14-1.19) for all-cause mortality |
| UK Biobank, Eppinga RN et al. (2016)5 | 265,046 individuals in the UK Biobank, 4.9 years follow-up | Significant association was found between genetic variants associated with RHR and all-cause mortality. Relative increase of 20% in all-cause mortality risk per 5 bpm increase of RHR; reduction in life expectancy for males between 1.9 up to 4.1 years and females 1.8 up to 3.7 years per 5 bpm increase in RHR |
| UK Biobank, UbbLE (UK Longevity Explorer)2 | 159,769 healthy males, 5 years follow-up | Increased pulse rate is associated with an increase in all-cause mortality. This risk tended to be higher at younger ages. (See Figure 1) |
| The Kailuan Study, Wang A et al. (2014)6 | 92,562 participants, 4 years follow-up | Risk of all-cause mortality rose by 18% per 10 bpm increase in RHR; HR 1.18 (95% CI 1.13–1.23) after adjusting for all confounding factors. |
| Framingham Heart Study, Ho JE et al. (2014)7 | 4,058 Framingham participants, 20 years follow-up | Higher RHR was associated with increased all-cause mortality, HR 1.17 (95% CI 1.11 to 1.24) per 11 bpm increase in heart rate, in a multivariable-adjusted model. |
| Copenhagen Male Study, Jensen MT et al. (2013)8 | 2,798 healthy middleaged men, 16 years follow-up | Compared to men with RHR ≤50, those with a RHR >90 had an HR of 3.06 (95% CI 1.97 to 4.75). RHR as a continuous variable: mortality risk increased 16% (10–22) per 10 bpm. |
In the Framingham Heart study, Ho JE et al. (2014) found that RHR captured at a single examination was as strong a predictor of cardiovascular outcomes as was repeated measurements of RHR averaged over 8 years.7 However, Wang A et al. (2017), the researchers of the Kailuan study, found that elevated long-term RHR variation is associated with increased risk of allcause mortality, suggesting that serial RHR readings may be more predictive than a single measurement.6
In the Melbourne Collaborative Cohort study, Seviiri M et al. also analyzed how changes in RHR over approximately a decade affects mortality. They found increases in RHR over the long term were associated with higher mortality, particularly if RHR increased by more than 15 bpm. Interestingly, a decrease in RHR was not associated with lower mortality.3
In summary, these studies provide support for the concept that elevated RHR can predict life expectancy in healthy lives independently of other known risk factors.
Heart rate recovery: Recover fast, die last
Heart rate recovery (HRR) is the speed at which the heart rate decreases after cessation of physical exercise. A rapid recovery time indicates the heart is working efficiently and is able to return quickly to a normal state. Speed of HRR is known to improve with physical fitness and is used by many athletes to monitor changes in their training status.
Although the exact underlying mechanisms are unclear, there is significant evidence to support the idea that a slow HRR is associated with adverse health outcomes.
Mortality data for heart rate recovery
A 2017 meta-analysis of nine studies confirmed the importance of HRR for predicting mortality. These findings were then supported by a major Mayo Clinic study published in 2018 (Table 2). Both analyses show the association between attenuated HRR and all-cause mortality was independent of traditional factors for cardiovascular disease.
Although a normal HRR reference range has not yet been established, both Cole et al. (1999) and Sydo N et al. (2018) used a reduction in heart rate of less than 13 beats within the first minute after the cessation of exercise as abnormal.
In the Qiu S et al. study, sub-group analysis showed that 2-minute HRR did not differ substantially from 1-minute HRR in predicting mortality. In contrast, however, a heart rate study by van de Vegte YJ et al. (2018) reviewed HRR data for 40,722 UK Biobank participants and found that HRR measured 10 seconds after cessation of exercise was a better predictor of mortality than measurements of HRR at longer intervals, up to 1 minute.12
This data suggests that the faster the heart rate recovers, the better the life expectancy.
Table 2: Heart Rate Recovery Mortality Data
| Study | Description | Findings |
| Mayo Clinic, Sydo N et al. (2018)9 | 19,551 participants, 12 years follow-up | Abnormal HRR was a significant predictor of allcause mortality, HR 1.56 (95% CI 1.3–1.7). |
| Meta-analysis, Qiu S et al. (2017)10 | Nine studies, 41,000 participants | Pooled HRs associated with attenuated vs. fast HRR were 1.68 (95% CI 1.51-1.88) for all-cause mortality |
| Cleveland Clinic, Cole CR et al. (1999)11 | 2,428 participants, 6 years follow-up | Abnormal HRR associated with adjusted relative risk of 2.0 (95% CI 1.5–2.7) for death. A value of <12 beats within the first minute of recovery was considered abnormal. |
Heart rate variability: High HRV, low mortality
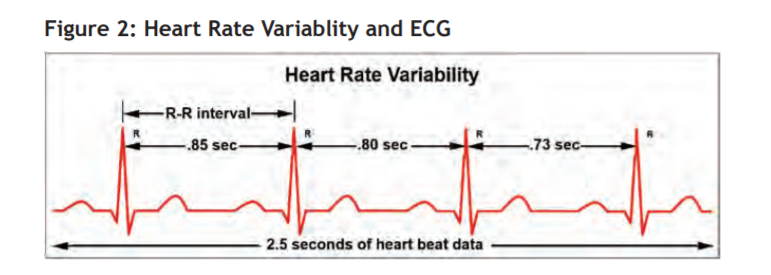
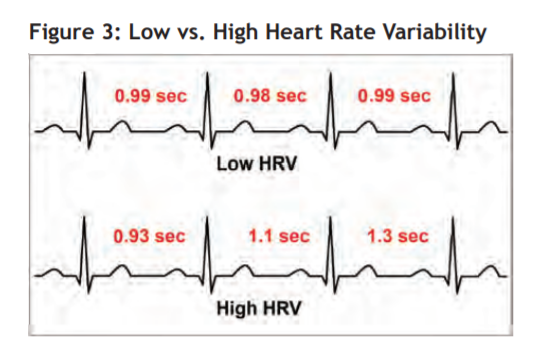
Heart rate simply measures the average number of beats per minute. Heart rate variability (HRV) measures the beat-to-beat interval, i.e., the difference in milliseconds between each successive beat. A heart rate of 60 beats per minute does not mean the heart beats once every second: there is a variation in the intervals. If the intervals between heartbeats are relatively constant, HRV is said to be low, while a wide variation in interval times means high HRV.
HRV is also known as the R-R interval, where R is a point corresponding to the peak of the QRS complex of the ECG wave; and R-R is the interval between successive Rs. It can be measured non-invasively by an ECG or a wearable device. Traditionally HRV was measured during a resting ECG. Currently, modern wearable activity trackers and smartphone apps can accurately measure HRV using pulse wave signals from a photoplethysmograph (optical pulse oximeter).


Heart rate variability mortality data
There is growing evidence about the prognostic utility of HRV in the absence of diagnosed cardiovascular diseases. Several studies show low HRV is associated with increased risk of cardiovascular disease and a reduced life expectancy (Table 3).
Table 3: Heart Rate Variability Mortality Data
| Study | Description | Findings |
| The Atherosclerosis Risk in Communities Study, Kubota Y et al. (2017)13 | 9,744 participants | Greater HRV was modestly associated with lower lifetime CVD risk: lifetime risks of CVD in the lowest vs. highest tertiles of HRV were approximately 49% vs. 45% for men and 38% vs 30% for women, respectively. |
| The MESA Study, O’Neal WT et al. (2016)14 | 1,175 participants free of cardiovascular disease / risk factors | Low HRV was an independent predictor of increased risk of CVD and all-cause mortality. “Borderline abnormal” and “abnormal” HRV had an HR of 1.37 (95% CI 1.11 to 1.69) and 1.53 (95% CI 1.11 to 2.11) respectively. Borderline abnormal and abnormal values of all normal-to-normal R-R intervals were reported as <5th percentile and <2nd percentile standard deviations, respectively. |
| Meta-analysis, Hillebrand S et al. (2013)15 | Eight studies, 21,988 participants | Low HRV was associated with approximately 40% increased risk of a fatal or non-fatal first cardiovascular event compared to high HRV. |
| The ARIC Study, Dekker JM et al. (2000)16 | 14,672 participants | Low HRV was associated with increased risk of CHD and death from all causes. |
Reliability and accuracy of wearable device data
Insurers must take considerable care when including additional data sources in the underwriting process. Research and testing is important in order to have confidence in the quality of data that is produced from wearable devices. RGA has conducted several research studies to better understand these metrics.
One study included around 1,000 participants who primarily used two wrist-worn fitness trackers. Over the 12 weeks of the study, the average number of steps recorded by one device was approximately 8% higher than by the other device. Additionally, a comparison of steps recorded from the wearable device of one user was found to be considerably different than the steps measured by the same user’s smartphone. Device-agnostic programs that allow participants to submit data from multiple devices will need to assess carefully the metrics and account for the differences in metrics collected from device to device.17
See also: Underwriting the Quantified Self
While there may be variation in step count output by different devices, the research from a subsequent RGA wearable device study showed the potential for wearable devices to capture heart rate data accurately. This study included approximately 250 participants using a single wrist-worn device and included a health evaluation at the beginning of the study. The study found that measures of heart health such as heart rate recovery and heart rate variability show promise for differentiating mortality and morbidity risk.
To assess the accuracy of heart rate data collected from the device, one participant shared data from a polar chest strap worn over the same time period in order to compare the metrics to those gathered by the wrist-worn device. A detailed review of the data collected during a time of known physical activity found that heart rate measurements from the wrist-worn device and the chest strap were remarkably similar.
Wearable devices have the potential to provide data that will enable underwriters and clinicians to better understand other indicators of heart health, such as pulse wave velocity and VO2 max (the maximum amount of oxygen an individual can utilize during intense [or maximal] exercise). However, life underwriters looking to include these measures in their processes will need to create accurate algorithms to evaluate these measures from device data. For example, heart rate recovery may be determined using the difference between a heart rate measured during a period of physical activity and a heart rate measured during a period of rest. An effective algorithm would need to accurately identify periods of activity and inactivity. Careful review of device output is needed to verify the accuracy of models using wearable data.
Underwriting implications
As device accuracy continues to improve, the ability for insurers to use a range of heartbeat data to assess health is becoming more promising. Data from wearable devices captures supplemental information beyond BMI, blood pressure and cholesterol, which may enhance an underwriting decision. This gives an opportunity for insurers to develop an improved understanding of mortality and morbidity risk.
Although it is still early in development, there is already a large body of evidence to support increased use of heartbeat data by underwriters. The evidence suggests this data will provide lift over traditional underwriting risk factors.
Key considerations for underwriters include the cost and convenience of obtaining the data, which heartbeat metrics offer the most value; and how best to use the data to assess risk.
- While serial heart rate readings are often available from electronic health records, wearable devices may provide the data more cost-effectively and conveniently. Insurers will need to consider carefully the logistics of accessing this data and incorporating it into the underwriting process. Clearly, this cost will be lower for insurers already accessing wearable data for other reasons.
- There is potential value in combining resting heart rate, heart rate recovery and heart rate variability into a single algorithm to predict cardiovascular and mortality risk. Additional information about physical activity corroborated by exercise heart rate data could allow further risk stratification.
- Heartbeat data could be used to apply greater granularity of risk stratification, particularly for preferred underwriting guidelines. Additionally, applicants for an accelerated underwriting program could be triaged according to their cardiorespiratory fitness level. In the longer term, heartbeat data might also be useful to refine assessment of various medical disorders such as heart disease, diabetes, smoking detection, depression, thyrotoxicosis and anemia.
- Wellness programs could also find heartbeat data useful as an additional data point for customer engagement and also to refine premiums as a result of cardiorespiratory fitness improvements.
Keeping our fingers on the pulse
Underwriters need to recognize the value of heartbeat metrics, find the best ways to access potential data sources, and determine the most effective way to use these metrics for risk selection. Initially, the focus could be on refining underwriting of preferred, standard and low-risk lives. In the longer term, more granular underwriting decisions based on heartbeat metrics could be pursued for impaired lives.
Continued advances in biosensor technology, growth in data from wearable devices, and access to longterm mortality data offer the promise of even greater things to come. It will be vital to ensure our guidelines keep abreast of such advancements.
Opportunities to improve underwriting accuracy using heartbeat data are within reach. Any improvements will give us a deeper understanding of each risk, enhance our ability to tailor evidence requirements, and ensure premiums remain commensurate with the risk – a win-win for insurers and customers alike.


