Key takeaways
- Artificial intelligence (AI) at the heart of new digital tools allows actuaries to extract structured data useful for creating more precise risk assessment models.
- This technology sits best alongside the expertise of insurance professionals who have years of experience in the industry.
- RGA’s partnership with DigitalOwl is an example of how AI combines with human knowledge for the best outcomes.
Both underwriters and actuaries bring deep expertise in experience-driven risk assessment. However, a general disconnect persists between underwriting and actuarial systems.
Underwriting evidence, impairments, and the rationale behind decisions are typically locked within legacy systems, workbenches, and rules engines – often in unstructured formats. Only a limited set of codes is passed to administration systems for use by actuarial models.
This leads to the familiar actuary refrain: “That is a brilliant idea, but we just don’t have the data.”
Advanced digital tools strengthened by AI are changing the situation.
This article examines several instances showcasing the power of structured underwriting data from an actuary’s perspective. It also details one partnership that demonstrates how AI can be used to extract useful data from piles of information and enable better risk management decisions.
Exhibit 1: Distribution of classes by total cholesterol count
A casual glance at the above chart might lead an underwriter to point out that cholesterol is only one of many factors affecting a class. It might also lead an actuary to argue that the chart demonstrates no clear pattern between these two variables. Both are correct.
But both would also be missing the point.
For the first time in the industry’s history, insurers now possess the data and capabilities to create such charts. More importantly, they now have longitudinal data of vital signs and lab results such as weight, blood pressure, and A1C that can be linked to variables in administration systems and experience studies.
This capability allows the exploration of a wide variety of scenarios. For example:
- If the cholesterol threshold for super-preferred is lowered, how many more people would qualify?
- Which point-in-time cholesterol value, or the pattern of changes, is the most predictive of mortality?
While some companies may have captured insurance laboratory cholesterol values at the time of underwriting, virtually none would have captured every cholesterol value in the file. These granular insights can refine underwriting manuals and, when combined with rules engines, produce actionable, more precise rules and models.
This machine-readable knowledge will transform underwriting processes. For instance, actuaries and underwriters can use structured data to identify cases more likely to be placed, thereby prioritizing valuable underwriting resources.
Exhibit 2: Distribution of application status by A1C
While this purely illustrative chart may not show a significant relationship, the integration of data such as A1C levels with the thousands of other available data points can be programmed into an underwriting process to pre-fill impairment codes in a workbench, target certain cases for post-issue audits, or build accelerated monitoring programs. The possibilities are truly endless.
Recent years have seen a surge in new underwriting data, tools, models, and innovative uses of existing information. Many carriers have questioned how protective some of these tools really are. Traditional actuarial approaches, while based on credible data sets and thorough experience studies, often miss the rich context considered by underwriters when evaluating a case.
On the other hand, the underwriting approach provides a holistic view of the application but lacks the scalability and credibility offered by data-driven methods. Successful integration of AI tools can enable protective value analysis at scale, speed, and efficiency. By submitting the same cases with different permutations of evidence, insurers can measure the exclusivity directly.
Exhibit 3 – Impairments captured
As a proof of concept, the table below features a small number of cases submitted twice, once with APS and EHR, then again with APS and insurance labs and Rx histories. This study compared the number of medical conditions each run captured.
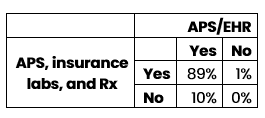
Based on this very limited sample size, adding EHRs to APS unsurprisingly appears to capture more impairments than adding insurance labs and Rx histories. As underwriting files are scaled, specific evidence types can be targeted and their incremental value of capturing major impairments precisely quantified.
Experienced underwriters often are skeptical of this data-driven approach. How can digital risk assessment compete with decades of on-the-job expertise? Many insurtech companies with novel products struggle to place their digital evidence alongside traditional underwriting processes to pinpoint improvements, win trust, and enable carriers to confidently move forward. By structuring natively imaged underwriting data files, companies can use established methods to validate and reconcile these new tools.
The RGA/DigitalOwl Partnership
In January 2024, RGA announced a strategic investment and exclusive global life and health reinsurance partnership with DigitalOwl, an insurance technology company that uses advanced AI to interpret and transform medical records into a comprehensive and interactive medical record summary.
This partnership is part of that fundamental change in which digital tools exist alongside traditional underwriting expertise to create more informed risk management decisions.
DigitalOwl ingests volumes of medical underwriting evidence and generates comprehensive summaries in both unstructured PDF files and structured formats, such as Excel and JSON files adhering to the HL7 v4 (FHIR) standard. These structured files include medical items, conditions, lab results, prescription histories, and key findings.
DigitalOwl also offers several API codes for users to interact with this detailed data, enabling machine-readable files for underwriting engines and workbenches, as well as tabular formats for research and analytics.
To date, RGA’s in-force analysis has included approximately 26,000 underwriting files, more than five million pages, processed by DigitalOwl and returned to RGA. In the first phase, these files were transferred via a customized process. Although this analysis is at an early stage, the potential is undeniable.
Below is a confusion matrix comparing when DigitalOwl identified Type 2 diabetes mellitus vs. RGA manual impairment codes.
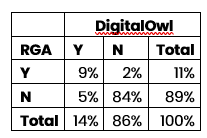
The rows represent whether RGA identified Type II diabetes in its underwriting system, while the columns indicate whether DigitalOwl did. For example, in 5% of cases, DigitalOwl flagged an impairment that wasn't coded in RGA’s underwriting systems. While there are hypotheses for this mismatch – such as the purpose of capturing impairments in an internal system vs. the purpose of APS summaries – the real breakthrough is the newfound ability to explain these differences with accuracy and confidence.
The potential of structured data is only now starting to be explored. For the first time, insurance professionals can combine underwriting information with claims data, opening the door to leverage analytics for fraud detection and claims rescissions.