Adding to the complexity of LTD, claims experience has historically been volatile, and it develops over a long period of time due to the nature of the risk.
To successfully manage the disability portfolio and stay profitable, it is important to track the most relevant metrics, understand what each measures, and to monitor them on a regular basis. The question then becomes what are the most relevant metrics? In effect, what should you be looking at in order to quickly identify emerging trends in your portfolio and stay ahead of the game?
Traditional Metrics
Usually, the main focus is on the income statement since it will ultimately dictate the financial results. While it contains essential metrics to track, it has some drawbacks. For example, variations over time coming from several sources make it difficult to spot trends. In addition, it is a lagging indicator, meaning that by the time a problem is identified in the income statement, it has usually been going on for a while in your portfolio.
According to a recent survey conducted by RGA on profit metrics, the most frequently used metric is the loss ratio. It has the advantages of giving an overview of the performance by cohort years and helping identify underperforming years. The downside is that further investigation would be needed to identify the underlying cause of the performance.
Forward-looking Indicators
In order to understand your LTD portfolio at a deeper level and notice trends before they have a significant impact on your results, you need to look at forward-looking indicators.
These include inventory, operational and financial metrics. Although these are all beneficial, the most important metrics are the ones measured against pricing to give you a sense of what is really happening. Ideally, these metrics are presented in a dashboard, which shows all of the pertinent metrics in one report.
Inventory Metrics
This data gives you an indication of the risk that you have in your portfolio allowing you to look for any shifts that can occur over a period of time. They include an overview of the types of groups (for example number of groups by size, region, type of industry, effective date, renewal date) and type of claims (for example number of claims by demography) you have in your portfolio.
Operational Metrics
These metrics are centered on claims management as it relates to staffing considerations, measuring the efficiency of returning disabled employees to work, and monitoring third-party claim management expenses. They include information on average case load per adjudicator, turnaround times, number of claims past the expected return dates, and average expenses paid to third parties.
Financial Metrics
Financial metrics are arguably the most important to monitor. Comparing them against pricing will give you an idea of pricing adequacy and underwriting performance. By detecting early signs of trouble, you can react and make sure you identify and address problems before they impact profitability.
Examples include premium execution on quotes and renewal (sold premiums vs. required premiums), closing ratios on quotes, premiums sold, group retention rates, incidence rates, termination rates and approval rates. Of course all the above can be sliced and diced as needed, but for monitoring purposes an overall view is ideal.
Implementing the dashboard
The metrics discussed here usually come from different systems, so incorporating them into monthly reports can be challenging. Investing the time and resources to build a centralized data warehouse where all the relevant metrics can be accessed quickly will make producing the reports easier.
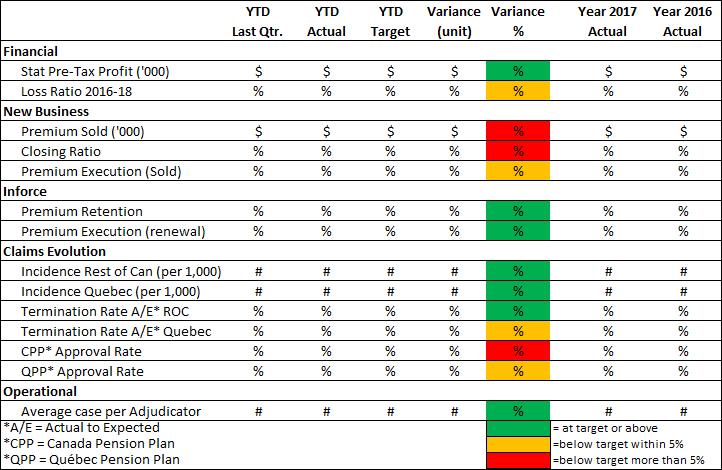
Just as not having enough metrics can be a problem, so can having too many, especially if they are undifferentiated. It is important not to get lost in a sea of metrics and to focus on those that provide a big picture view of what’s going on in your portfolio and that are most relevant for you. One way to accomplish that is to design a dashboard that conveys the key information in an efficient manner. Below is an example of a concise table representing a dashboard that provides early indicators of performance in your LTD portfolio. The indicators color coded in red can be further investigated. Remember that you can always dig further if you think that something looks off.
The bottom line
Long-term disability is complex with several moving parts and volatile experience. It has been, and continues to be, one of the more challenging employee benefits products to manage effectively. Given the complexity, poor results can often catch insurers by surprise. Therefore, this product merits close and constant monitoring. While no amount of management reporting can eliminate occasional shocks to the system, developing key forward looking metrics and dashboards can help a disability carrier adjust quickly and ‘in the moment’ rather than after the fact. In today’s competitive employee benefits market, that can be the difference between profits and losses.