This article follows up on two older articles by RGA associates: “Seasonality of Mortality,” by Kyle Nobbe, published in the January 2017 edition of ReFlections,1 and “Seasonal Flu and the Impact on Mortality,” by Dr. Dave Rengachary.16
These articles established that with the exception of cancer and non-natural deaths, almost all major causes of mortality are seasonal and more deaths are seen in winter. Also established was that influenza mortality exhibits significant variation from season to season, with a greater than tenfold difference in mortality between the least and most severe seasons. Finally, data from U.S. and Japan demonstrates a statistically significant positive correlation between excess deaths due to influenza and pneumonia and excess deaths due to all other medical causes.
Several theories attempt to rationalize why all-cause mortality is seasonal. The severity of influenza during a given season might offer insight into how severe overall mortality during that season might be. Additionally, although influenza and pneumonia deaths are only a small proportion of overall seasonal mortality, they could serve as valuable indicators of overall mortality during a given influenza season. Knowledge of an influenza season’s potential severity, either in advance or at onset, might also help insurance companies improve their financial planning and explain their earning patterns. Also important to consider is that age is the most significant risk factor for influenza mortality: greater than 90% of influenza deaths in recent decades have occurred in people age 65 and older.
RGA is partnered with BlueDot, a Toronto-based company that studies how infectious diseases disperse worldwide through analysis of big data, and brings together predictive modeling and data visualization to deliver timely evidence to decision-makers. This article presents the RGA/BlueDot partnership’s most recent, focused research on seasonal influenza mortality variation.
Introduction
Although influenza epidemics occur every year, the severity of these epidemics, as measured by physician visits, hospitalizations, and influenza-attributable mortality, varies from season to season. The ability to predict the severity of a particular influenza season improves as the season progresses. There is a continuous stream of influenza data collected globally, which when examined collectively, offers insights into how severe the upcoming influenza season might be.
Wading through the various data sources and understanding how all of these different metrics relate to influenza season severity is a complex task. RGA partnered with BlueDot to i) describe the process by which data about influenza are collected globally, highlighting the significance of these data with respect to influenza-attributable mortality, and ii) develop a statistical model, using 15 years of historical mortality data from the United States, to assess if and when selected indicators could predict excess influenza-attributable mortality.
An example of how influenza-attributable mortality varies across seasons is shown in Figure 1 (below). Here, data from the Centers for Disease Control and Prevention (CDC) WONDER databases from the 1999-2000 to the 2014-2015 seasons for the U.S. population age 65 and older was used to estimate excess deaths per month over that 15-year span. The baseline came from a Serfling periodic regression model, the standard CDC algorithm for calculating excess influenza-attributable mortality. This model controls for linear and quadratic trends as well as annual cyclical patterns.
Influenza Data Generation Process
In the northern hemisphere, influenza season normally starts in October and ends in April, while in the southern hemisphere, influenza season typically occurs between May and October. The different timing of influenza seasons in the northern and southern hemispheres means that data on influenza activity are generated throughout the year. These data are gathered by local, national, and international organizations, and their use has the potential to improve the ability to predict not only influenza and pneumonia mortality for a given season, but potentially overall mortality as well.

Before investigating how different indicators can help anticipate the severity of an influenza season, it is important to understand the various sources and types of data that are collected. A large volume of data are generated relating to both influenza activity and the characteristics of circulating influenza viruses. We sought to describe the complex processes by which influenza data are collected and to identify indicators that might be used prior to or during the early stages of influenza season to better predict influenza-associated mortality
Two important collectors and disseminators of influenza data are the World Health Organization (WHO) and the CDC. Each uses a variety of methodologies to monitor and collect data on the severity of influenza seasons. WHO’s FluNet, a global tool for influenza virological surveillance, reports weekly, by country, the number of specimens processed that test positive for different influenza subtypes. The CDC’s FluView provides similar information for the U.S. only, reported at the national and regional level.
In late September to early October, prior to the onset of the U.S. influenza season, the CDC’s Morbidity and Mortality Weekly Report (MMWR) publishes a summary of influenza activity that occurred during the summer. The report includes the results of antigenic match assays performed in CDC laboratories, comparing the match between circulating viruses isolated in the U.S. and internationally to the viruses included in the seasonal influenza vaccine. The Worldwide Influenza Centre at the Francis Crick Institute in the U.K. also releases its summer report around September, although this report is more technical in nature and is not as easily interpretable as the MMWR report. Another source of antigenic match data comes from the Chinese National Influenza Center, which issues weekly reports of the proportion of influenza isolates matching the vaccine strain cumulatively since March. (The vaccine used in China is generally the same as the northern hemisphere vaccine used in the U.S.).
Starting in October and lasting throughout the U.S.’s influenza season, the CDC’s FluView reports on the cumulative proportion of isolates that match the vaccine strain, by influenza type.
Review of Indicators Associated with Influenza Mortality
These different data sources provide a number of potential indicators that may provide early warning signs as to the severity of an upcoming influenza season. BlueDot reviewed and synthesized the literature on different potential indicators and evaluated them on four criteria:
- What is currently known about the indicators’ relationship with influenza-attributable mortality, based on the existing biomedical literature?
- Can the indicator(s) be measured in a timely fashion, ideally before or during the early stages of an influenza season?
- Is data about the indicator(s) easy to obtain?
- Can the indicator(s) predict population-level influenza-attributable mortality before the onset of, or during, influenza season?
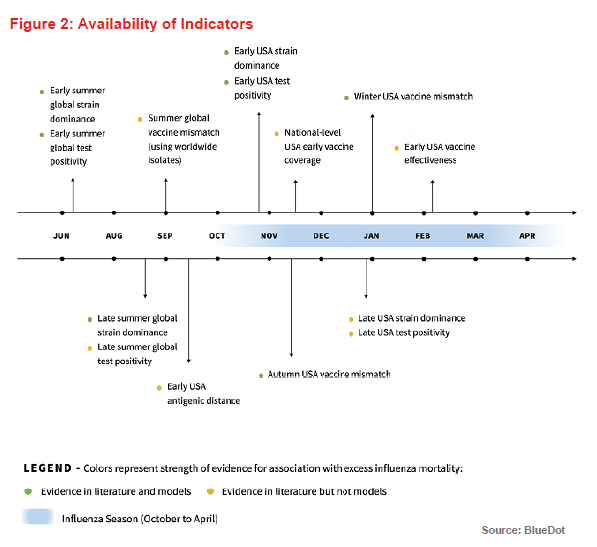
To be used for early warning, the time at which each potential metric becomes available is important. Figure 2 (above) provides a summary timeline of predictive indicators and their association(s) with influenza mortality in subsequent months as determined from the literature review.
Based on the literature review and the criteria for indicator availability either prior to or early on in an influenza season, we identified three potential indicators to predict the severity of an influenza season: influenza test positivity, dominant influenza subtype, and vaccine match. Notably, most existing literature about the association of different indicators with excess influenza-attributable mortality is retrospective, as the indicators were measured at the end of the season. We examined if different conclusions about the effect of these indicators on influenza-attributable excess mortality would be reached if estimates of these indicators were obtained prior to or early on in the influenza season.
To do this, the predictive value of each season’s severity indicators was measured at four time points during the season: June, September, November and January. At each time point, excess deaths due to influenza were summed from the month following the month when the indicator became available or October (whichever was later) until
the following April, and the correlation between cumulative excess deaths and individual indicators selected was examined, controlling for age group and gender. The model was focused on the U.S., but many of the indicators are globally available and the approach could be reassessed for countries in both hemispheres. Each of the indicators and their association with influenza mortality, both in the literature and in our predictive model, is reviewed below.
Some additional indicators that were identified in the literature review (vaccine effectiveness, vaccine uptake, and antigenic distance) were not included in the predictive models but are also described, as they have the potential to be used as early warning indicators in the future.
Influenza Test Positivity and Dominant Subtype
Several influenza virus types, subtypes, lineages, and strains exist. The most common are influenza A subtype H1N1, which caused the 1918 Spanish flu pandemic, and subtype H3N2, which has begun to be seen more frequently in recent years. The influenza B type, which is classified into lineages and strains, is also frequently seen. Influenza test-positivity refers to the proportion of influenza tests that are positive for any type of influenza virus, subtype or strain. Dominant subtype indicates the most prevalent subtype circulating during a season.
The association between dominant subtype and mortality severity is well documented in the scientific literature. In years when H3N2 was the dominant subtype, 2.7 times more deaths were recorded than in years when it was not.2 Influenza B-dominant years typically cause less mortality than H3N2-dominant years, and H1N1-dominant years are generally associated with the least amount of mortality.3 A possible reason for this observation may be due to how people develop immune responses to influenza viruses. People tend to develop a more effective immune response to the first influenza viruses they encounter in their lifetimes. As H1N1 influenza was most dominant in the childhoods of today’s older adults – those most vulnerable to influenza – they tend to mount a less robust immune response to the H3N2 viruses, resulting in more severe disease.
In the model we developed, increased influenza test positivity globally in June, or in the U.S. in November, is associated with higher excess mortality for the rest of the influenza season. Indeed, for every one percentage point increase in the proportion of positive tests for influenza globally in June, excess mortality in the upcoming influenza season increased by 3% – a modest but statistically significant value. Meanwhile, for every one percentage point increase in the proportion of positive influenza tests in the U.S., for all tests cumulatively between the beginning of the influenza season to November, excess mortality in that season rose by 4%. This effect was not, however, observed in January. Higher test positivity could be reflective of either less population-level immunity to circulating strains or more transmissible circulating subtypes and strains, resulting in higher population influenza burden and mortality.
Figure 3 compares the distribution of log excess mortality due to influenza by whether the influenza season is dominated by the H3 subtype or not. For this model, a subtype or strain was considered dominant if greater than 60% of influenza-positive samples were positive for it. Each column indicates 5th, 25th, 75th and 95th percentiles, as well as median and average. H3 dominance was assessed in June and September, when only global data were available, and in November and January, when U.S.-specific information was also available.
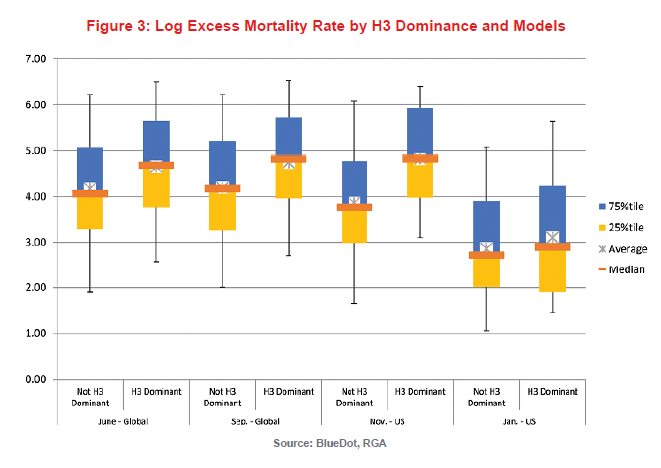
At each observation point, for influenza seasons during which an H3 strain dominated, the mortality experience was significantly worse than otherwise. If an H3 strain was dominant globally in June, a 52% increase in excess mortality due to influenza would have been expected in the upcoming influenza season. If it was still dominant globally in September, it would have been associated with a 66% increase. In the U.S., as indicated above, data are only available after October. If an H3 strain was dominant in November, it would be associated with a 130% increase in excess mortality due to influenza. This effect was not observable in our model for January, possibly because much of the season’s influenza mortality would generally have already occurred by then.
Vaccine Match
Vaccines work by generating an immune response in the human body to the strains and subtypes incorporated into the vaccine. An influenza vaccine will typically contain three or four strains and subtypes: an H1 subtype, an H3 subtype, and one or two B strains. If the H1 type in the vaccine matches the type that is circulating, but the H3 type does not, the vaccine protects against the circulating H1 but not the H3.
Sometimes the immune response that develops from vaccination results in strong protection against influenza viruses circulating duration an influenza season, and at other times the protection is weaker. The strength of an immune response to a vaccine can be assessed in a laboratory using a test that determines how effectively antibodies generated by the immune system in response to the vaccine inhibit a sample of influenza virus. In our model, a vaccine is considered “matching” if greater than 90% of the isolates (virus samples cultured from sources) were an antigenic or genetic match for the strains and subtypes incorporated in the vaccine.
Because this is a laboratory test, the antigenic match may not always be a good predictor of observed vaccine effectiveness in humans. This may reflect the fact that other types of immunity (such as cellular immunity) can also be important in protecting against influenza infection. Overall, antigenic match is generally correlated with vaccine effectiveness4, 5, 6 and is also correlated with other positive outcomes.7 A matching H1 strain, for example, was found in a 2014 study to have lowered pneumonia and influenza hospitalizations among the elderly by 24% and a matching B strain lowered them by 5%.8 A matching H3 strain lowers the number of excess pneumonia and influenza deaths by 22% in the elderly.9
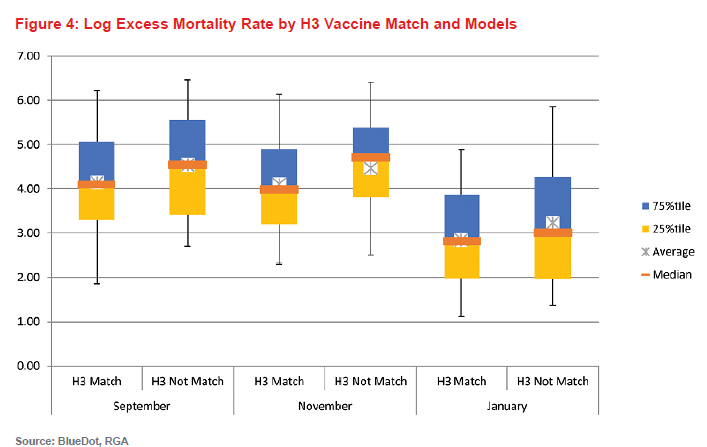
For our model, the antigenic match over the summer reported by the CDC in September/October was not found to be statistically significantly predictive of reduced rates of excess mortality. However, in subsequent months, matches for circulating H3 vaccine strains were associated with a downward trend in mortality. If greater than 90% of the H3 isolates by the end of November matched the vaccine strain, mortality decreased by 45% compared to years where it did not match.\
Figure 4 (below) is a chart of log excess mortality due to influenza by whether the vaccine matched the circulating H3 strain in September, November, and January. When there was no match, the data are more dispersed but indicates generally higher mortality than in influenza seasons where there was a match.
It is important to note that although the results are discussed for each of these indicators in isolation, each of the indicators considered in these models likely interact when considering their effects on influenza mortality. For instance, an H3-dominant season may result in more influenza transmission, and consequently, higher test positivity. Similarly, an H3 vaccine mismatch is unlikely to be as consequential in seasons that are dominated by H1N1 or B strains than in H3N2-dominant seasons.
Vaccine Effectiveness
Influenza vaccine effectiveness measures the effect of a vaccine on decreasing test-positive influenza infection among the vaccinated population versus the unvaccinated population. This is a measure of how well a vaccine will protect a population against influenza. An effective vaccine is expected to decrease mortality by decreasing the overall number of cases and severity of infection in those who are infected.10
Influenza vaccine effectiveness cannot be measured until influenza is circulating in the northern hemisphere, so early and interim measures of effectiveness against test-positive influenza are generally not available until January or February, and final estimates are not available until well after influenza season is over.
This may change in the future. Recently, research has been done in countries that routinely collect vaccine registry data to calculate vaccine effectiveness in real time. At the present time, since the data are not available until after the peak of the influenza season, it is not yet possible to use vaccine effectiveness as an “early warning” indicator.
Vaccine Uptake
Vaccine uptake refers to the percent of a population vaccinated against a disease. For influenza, vaccine uptake is measured annually since the vaccine generally works for only one year. Higher vaccine uptake protects vaccine recipients and if effectiveness is high, it can also protect people who were not vaccinated or those for whom the vaccine failed by limiting influenza’s spread through the community.
In the U.S., county-level vaccine uptake among adults 18-64 years old has been demonstrated to be associated with decreased odds of influenza among elderly residents, especially if the elderly adults were also vaccinated, if the antigen matches, or if the influenza season was more severe.11 Increased vaccine uptake in children also reduces respiratory illness rates in the rest of the community.12
National-level U.S. influenza vaccine uptake rates, stratified by age, race and ethnicity, and high-risk comorbid conditions, are available in November from the CDC. Uptake rates at the state level, however, are not available until well after the end of the influenza season. Since the herd immunity effect associated with vaccination work only at a local level by reducing susceptible contacts, this indicator cannot currently be included in predictive models.
Antigenic Distance between Current and Previous Circulating Strains
Antigenic distance measures how effectively exposure to one influenza strain can protect against another. It can be used to measure vaccine match or the difference between a current circulating influenza strain and a previous one. This is important, because if a person was exposed to an influenza strain in a previous season and the new one is antigenically close, that person will have some protection against the new virus.
Some evidence suggests that the antigenic distance between the current year’s strain and previous years’ strains is correlated with excess mortality.13 Because these data are difficult to obtain and interpret, they were not analyzed in our predictive model, but this may be an important indicator to incorporate into future models.
Implications for Insurers
While individual risk factors for influenza mortality have been well studied,14 indicators explaining the seasonal variation in mortality at a population level have received less attention. They do exist, and importantly, may be measured early in the influenza season. Generally speaking, influenza-related mortality is pro-cyclical to all-cause death seasonality (meaning that if influenza-related mortality rises, a rise in all-cause death seasonality will be seen). Thanks to different monitoring programs around influenza activities, indicators can be used for early warning or ongoing monitoring purposes. Although it is not currently possible to predict excess influenza-attributable mortality with accuracy, a high-level assessment of the general mortality experience may be possible prior to or early in an influenza season by examining early warning signs of severe influenza mortality.
Although the correlations between different indicators and influenza mortality may help predict influenza season severity, it is important to gain a better understanding of the underlying reasons for these relationships. Otherwise, we risk missing changing population trends. For example, as discussed above, people have been shown to develop a more robust immune response to the first influenza strains they encounter in their lifetimes. The current older generation, who are most vulnerable to seasonal influenza-associated mortality, encountered H1-dominated influenza seasons in their childhoods, making them more vulnerable to H3 infections. As populations age, and the older population transitions to individuals whose first exposure was to influenza of a different subtype (e.g., H3N2), this correlational relationship might also be expected to change. Additionally, there are other factors that may contribute to influenza severity but cannot currently be used as early-warning indicators. For instance, weather is believed to play a role in influenza season onset,15 and so may potentially influence the impact of other indicators on the seasonal pattern of mortality.
Most studies of population-level indicators of risk have focused on the general population. The U.S. influenza mortality data used in our model are only available for the general population, which may have differences in age distribution, health status, and access to healthcare compared to the insured population. Because of this, population level indicators of risk may affect an insured population differently from the general population. Hence, it is also important to understand individual-level risk factors. Although they are unlikely to cause marked effects in season-to-season influenza mortality, they may explain differences between the general and insured populations.